Residuals plot
plot_residuals.RdPlot residuals (e.g. CWRES, IWRES, NPDE) as either a
scatterplot (versus an independent variable), an histogram (distribution) or a quantile-quantile plot.
plot_residuals(run, compartment = NULL, idv = "TIME", residuals,
  absolute_residuals = FALSE, keep_time_zero = FALSE,
  type = "scatterplot", smoothing_method = NULL, smoothing_se = TRUE,
  reference_value = NULL, histogram_bins = 30L,
  histogram_empirical_density = TRUE,
  histogram_reference_distribution = list(fun = dnorm, args = list(mean =
  0, sd = 1)), qq_reference_distribution = list(fun = qnorm, args =
  list(mean = 0, sd = 1)), x_scale = "linear", y_scale = "linear",
  facet_scales = "free", transparency = FALSE, auto_legend = TRUE)
Arguments
| run |
|
|---|---|
| compartment | integer vector of the numbers of the compartments of residuals. |
| idv | character. Name of the column used as independent variable. Default is
|
| residuals | character vector of column names of residuals. |
| absolute_residuals | logical. If |
| keep_time_zero | logical. If |
| type | character. Type of representation of the residuals. One of
|
| smoothing_method | character. |
| smoothing_se | logical. Display confidence interval around smooth? |
| reference_value | numeric. Draws reference lines at +/- a particular value. |
| histogram_bins | integer. If |
| histogram_empirical_density | logical. If |
| histogram_reference_distribution | logical. If |
| x_scale | character. X-axis scale, one of |
| y_scale | character. Y-axis scale, one of |
| facet_scales | character. |
| transparency | logical. Plot scatterplot dots with transparency, useful to avoid overplotting with large datasets. Default is FALSE.#' |
| auto_legend | logical. When |
Value
A ggplot2 object.
Examples
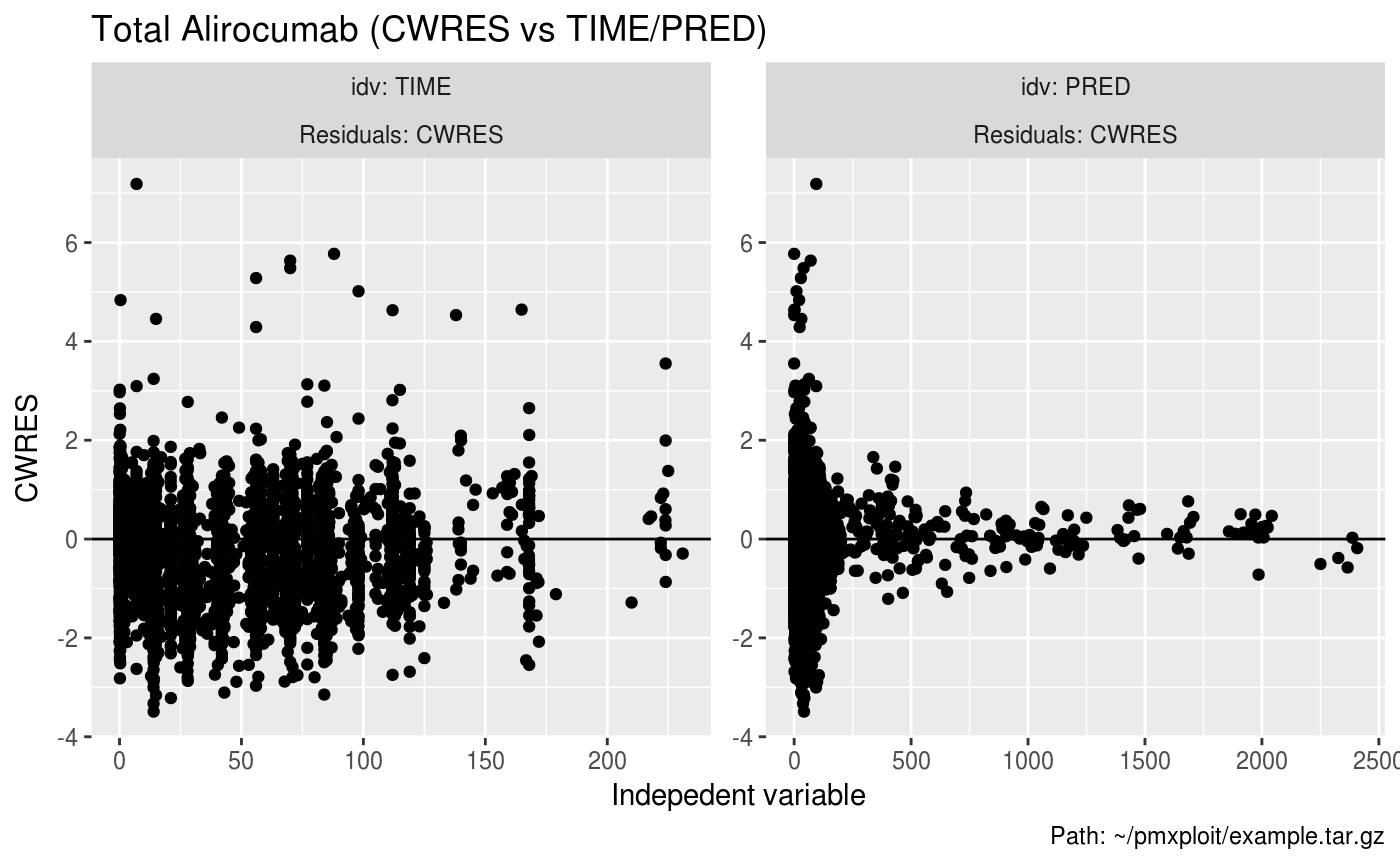
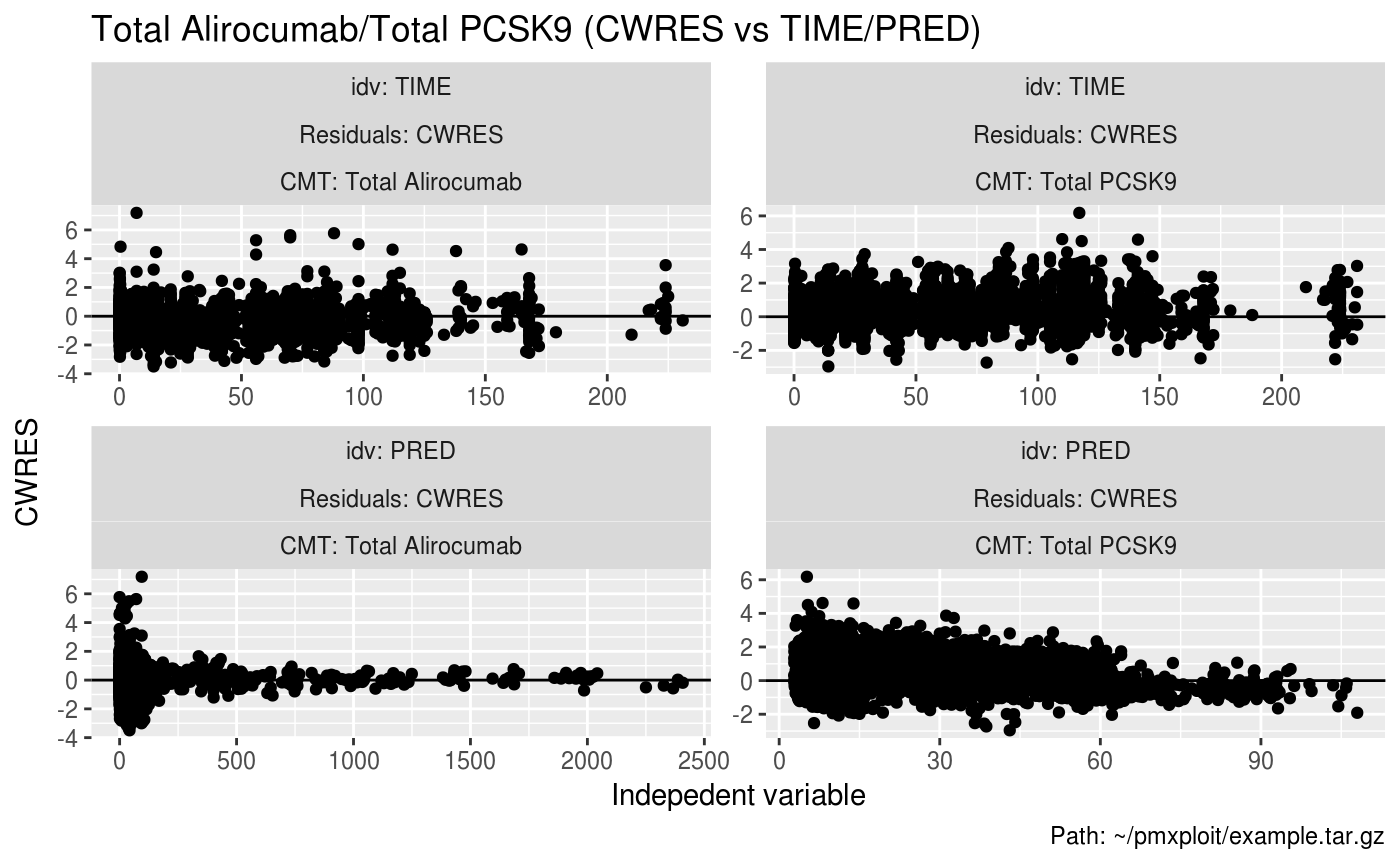
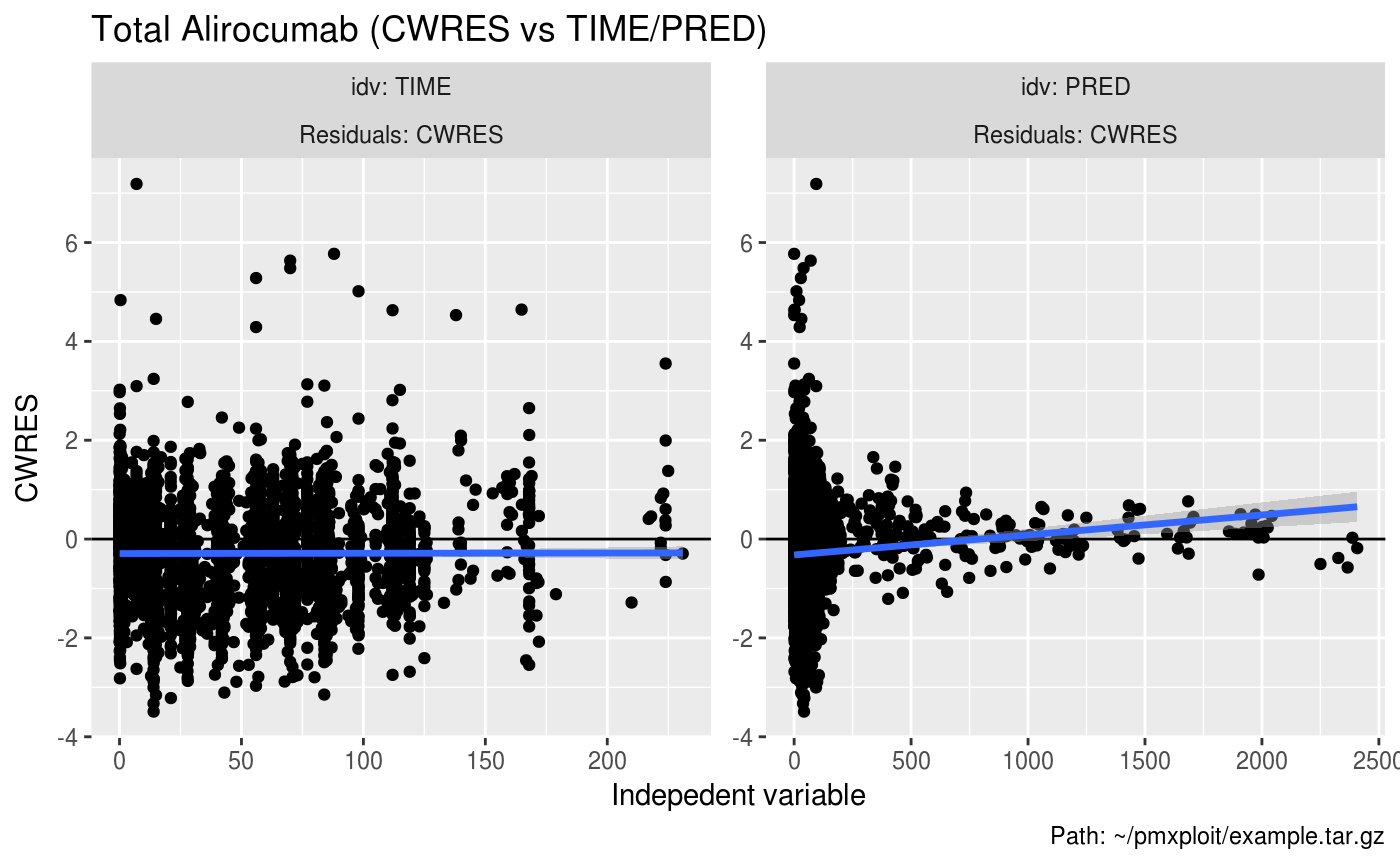
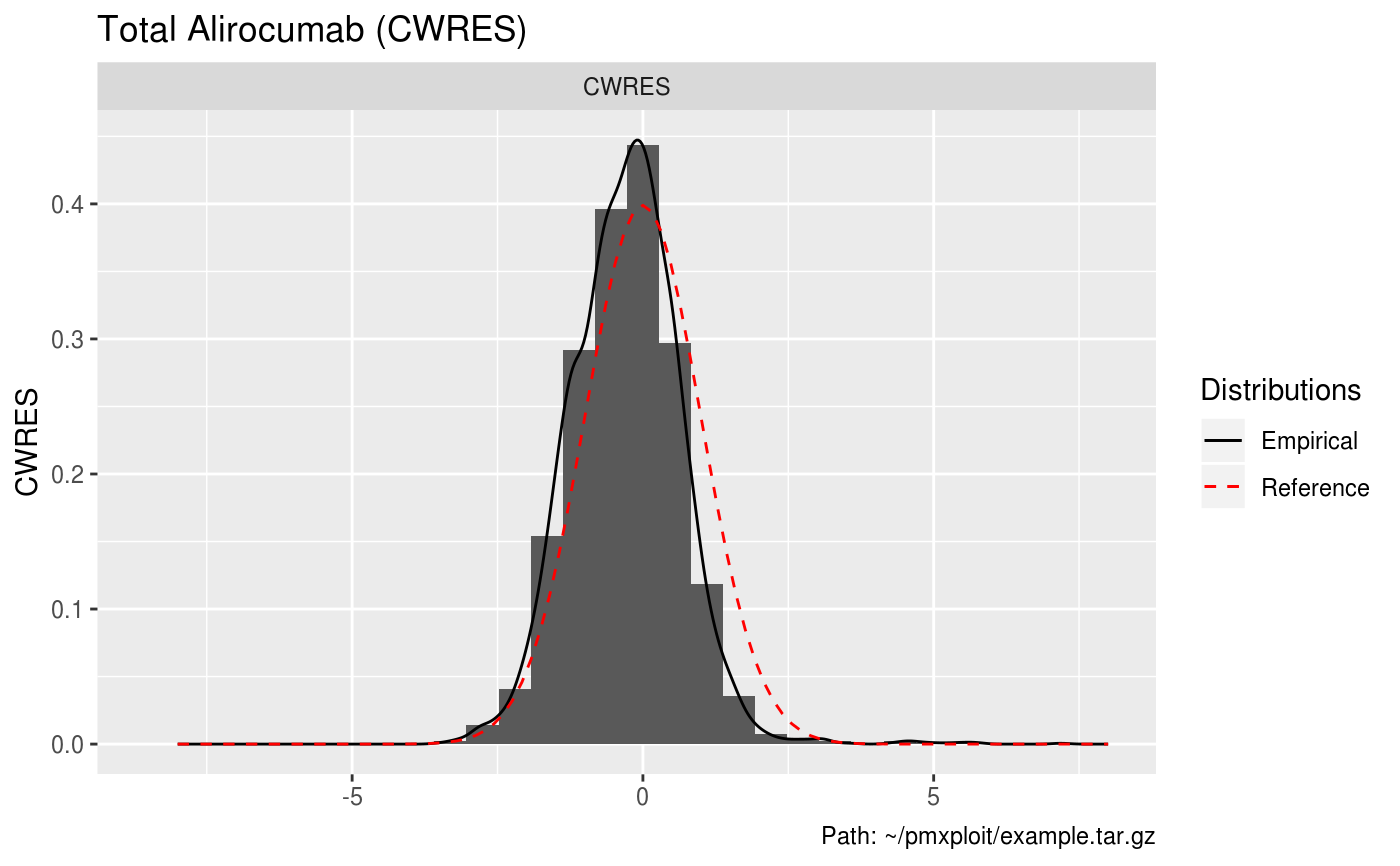
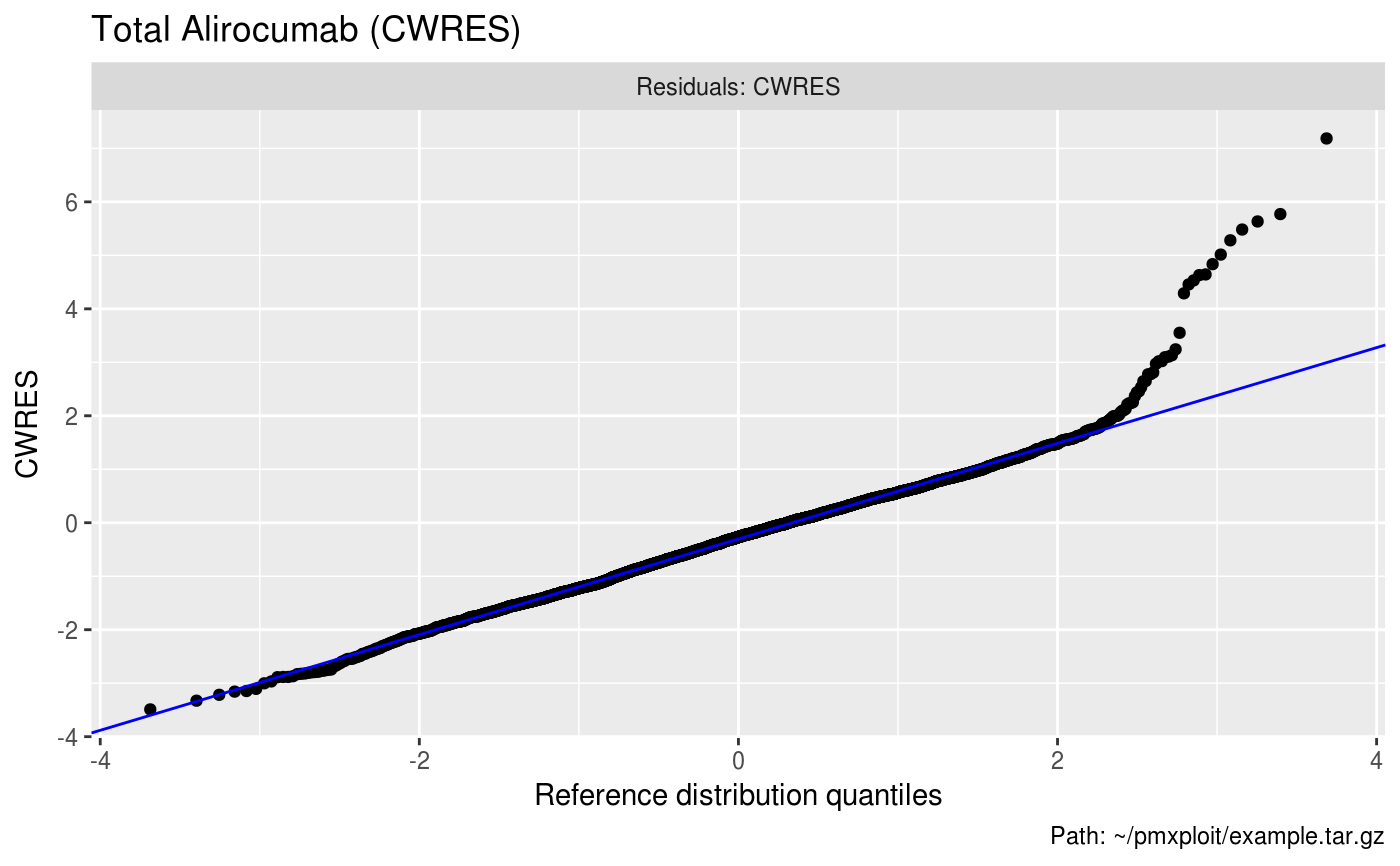
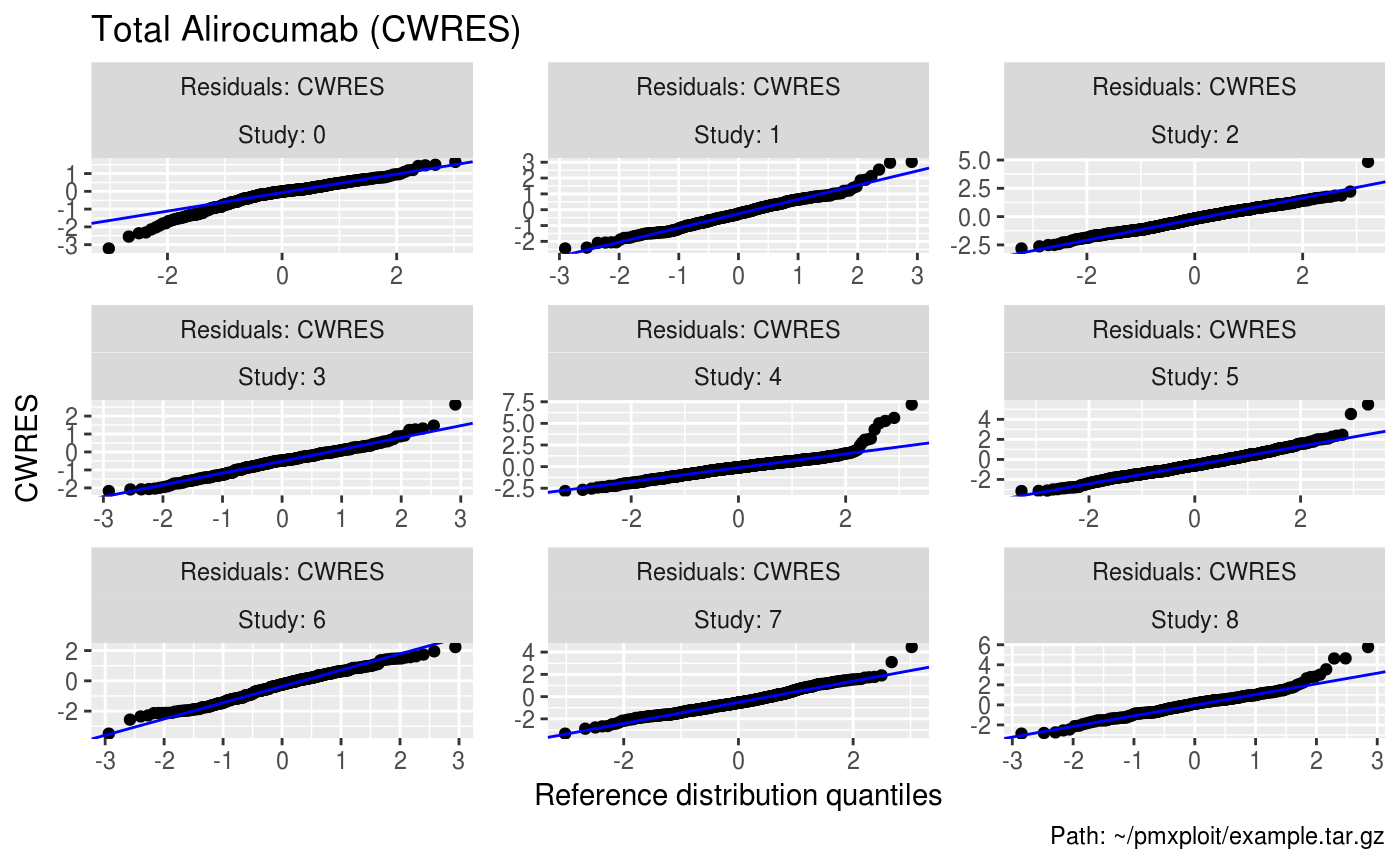
EXAMPLERUN %>% group_by(CMT) %>% plot_residuals(compartment = 2:3, idv = c("TIME", "PRED"), residuals = "CWRES")EXAMPLERUN %>% plot_residuals(compartment = 2, idv = c("TIME", "PRED"), residuals = "CWRES", smoothing_method = "lm")EXAMPLERUN %>% plot_residuals(compartment = 2, idv = c("TIME", "PRED"), residuals = "CWRES", type = "histogram")EXAMPLERUN %>% plot_residuals(compartment = 2, idv = c("TIME", "PRED"), residuals = "CWRES", type = "qq")EXAMPLERUN %>% group_by(STUD) %>% plot_residuals(compartment = 2, idv = c("TIME", "PRED"), residuals = "CWRES", type = "qq")