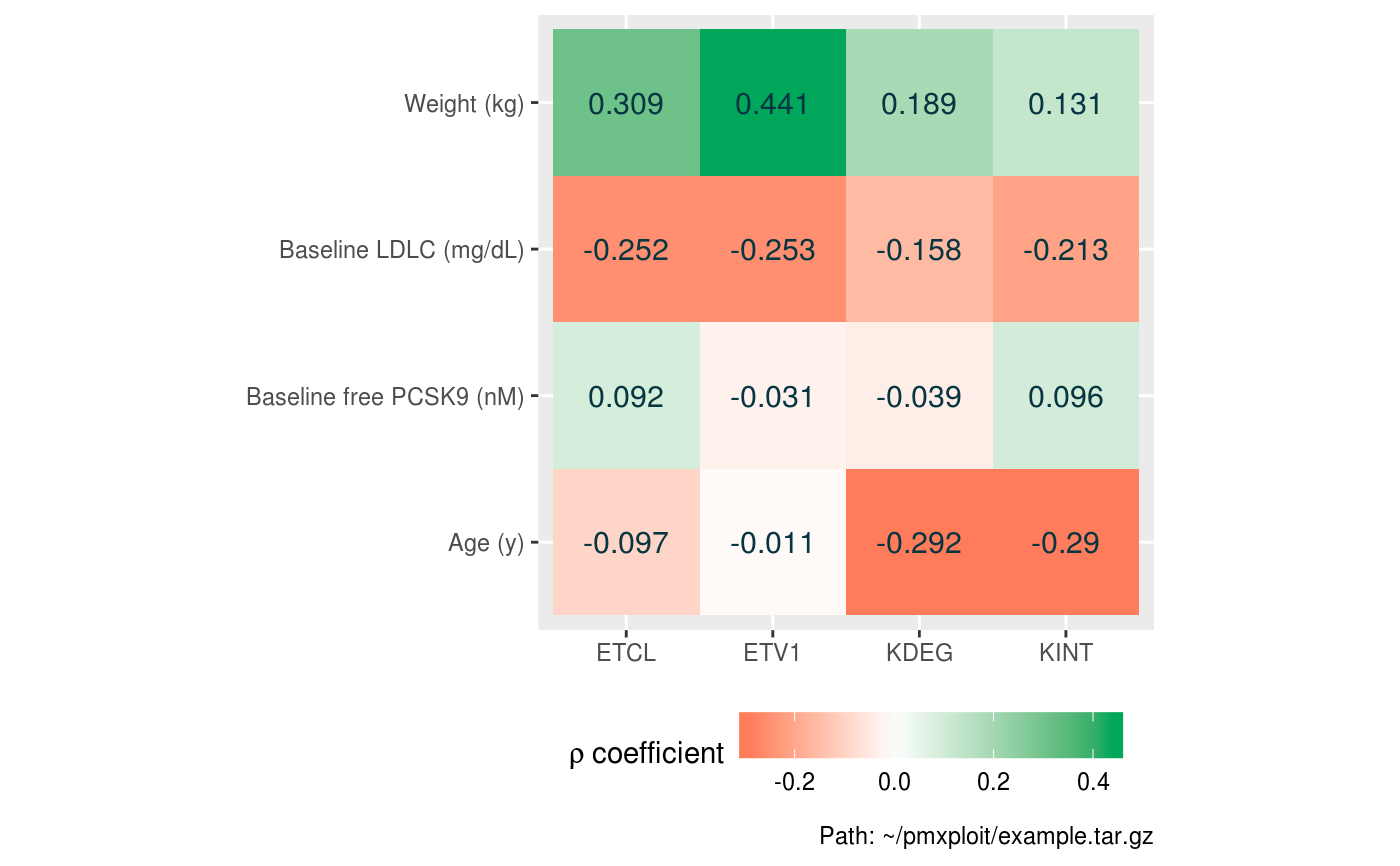
Parameters vs continuous covariates correlations
plot_parameters_vs_continuous_covariates.RdReturns a plot of the selected parameters and continuous covariates correlations.
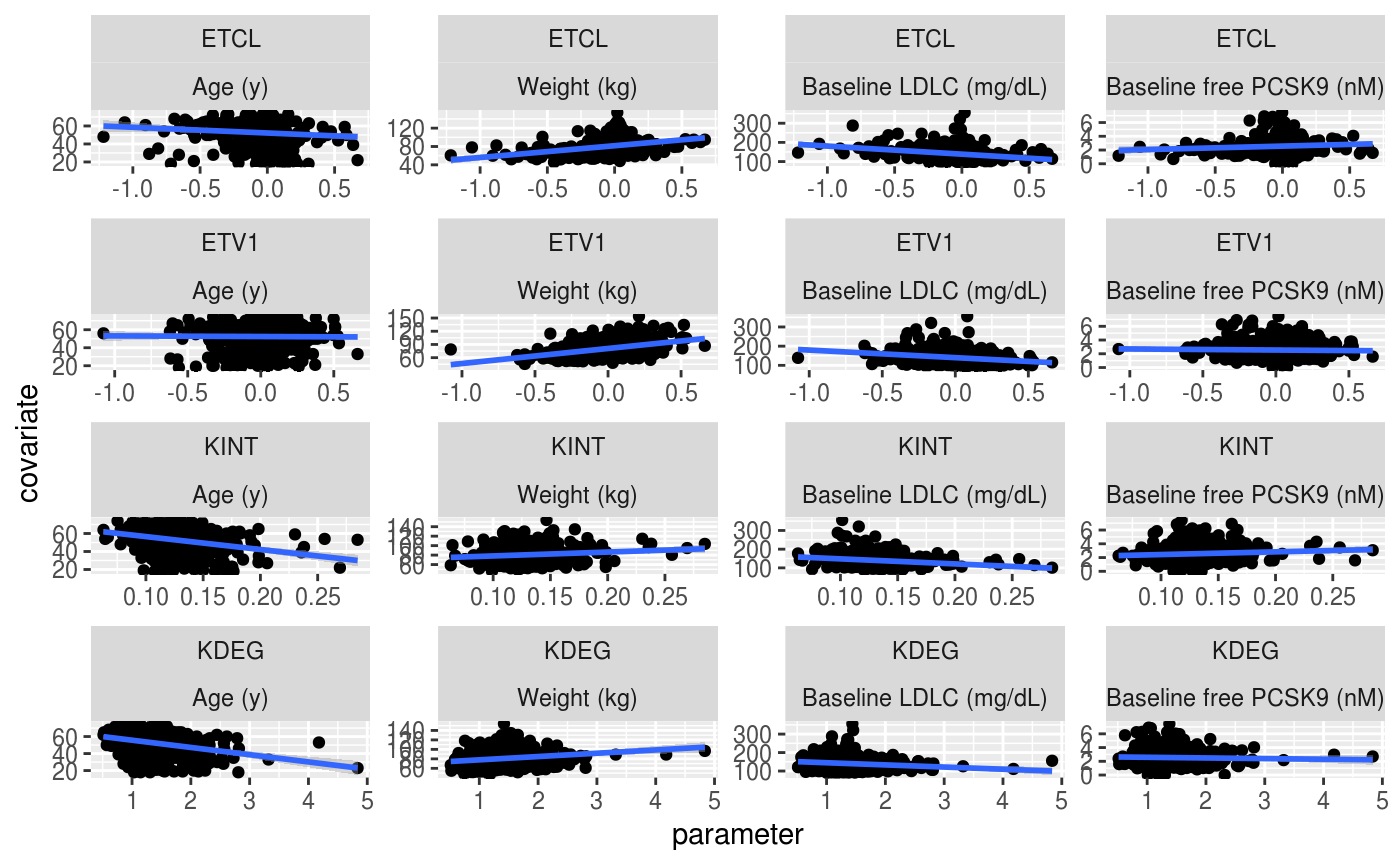
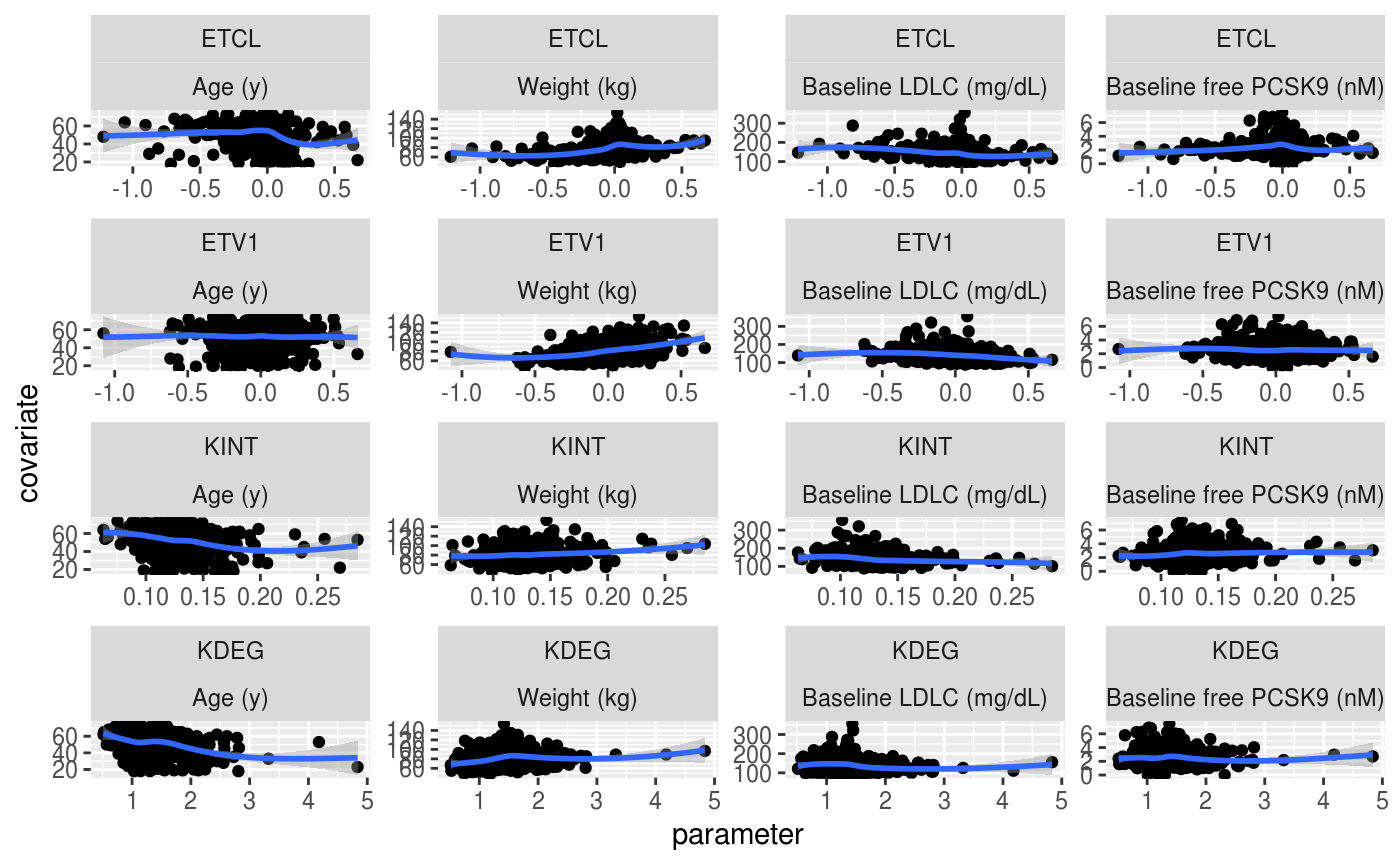
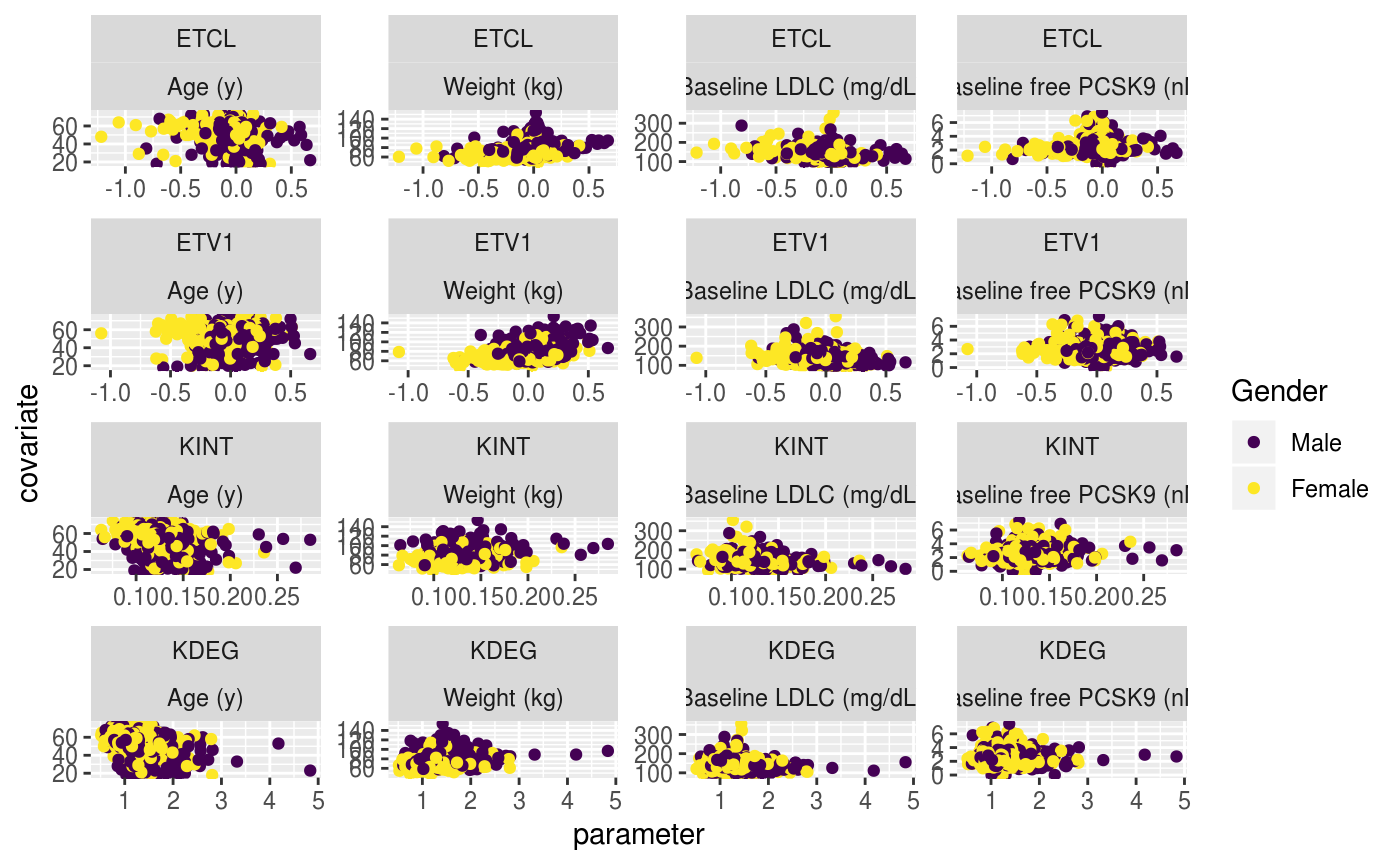
plot_parameters_vs_continuous_covariates(run, parameters = NULL,
  covariates = NULL, type = "heatmap", correlation_method = NULL,
  auto_order = TRUE, baseline_only = TRUE, smoothing_method = NULL,
  smoothing_se = TRUE, fixed_ratio = TRUE, auto_legend = TRUE)
Arguments
| run |
|
|---|---|
| parameters | character vector of parameters names. Default is |
| covariates | character vector of continous covariates names. Default is
|
| type | character. Type of distribution representation. One of
|
| correlation_method | a character string indicating which correlation
coefficient (or covariance) is to be computed. One of |
| auto_order | logical. If |
| baseline_only | logical. Consider only the baseline (= first) values of the subjects. Default is
|
| smoothing_method | character. If |
| smoothing_se | logical. Display confidence interval around smooth? |
| fixed_ratio | logical. If |
| auto_legend | logical. When |
Value
A ggplot2 object.
Examples
params <- c("ETCL", "ETV1", "KINT", "KDEG") covs <- c("AGE", "WT", "BSLDLC", "FBSPCSK") EXAMPLERUN %>% plot_parameters_vs_continuous_covariates(parameters = params, covariates = covs, type = "heatmap")+ ggplot2::theme(legend.position = "bottom")EXAMPLERUN %>% plot_parameters_vs_continuous_covariates(parameters = params, covariates = covs, type = "scatterplot", smoothing_method = "lm")EXAMPLERUN %>% plot_parameters_vs_continuous_covariates(parameters = params, covariates = covs, type = "scatterplot", smoothing_method = "loess")EXAMPLERUN %>% group_by(SEX) %>% plot_parameters_vs_continuous_covariates(parameters = params, covariates = covs, type = "scatterplot")