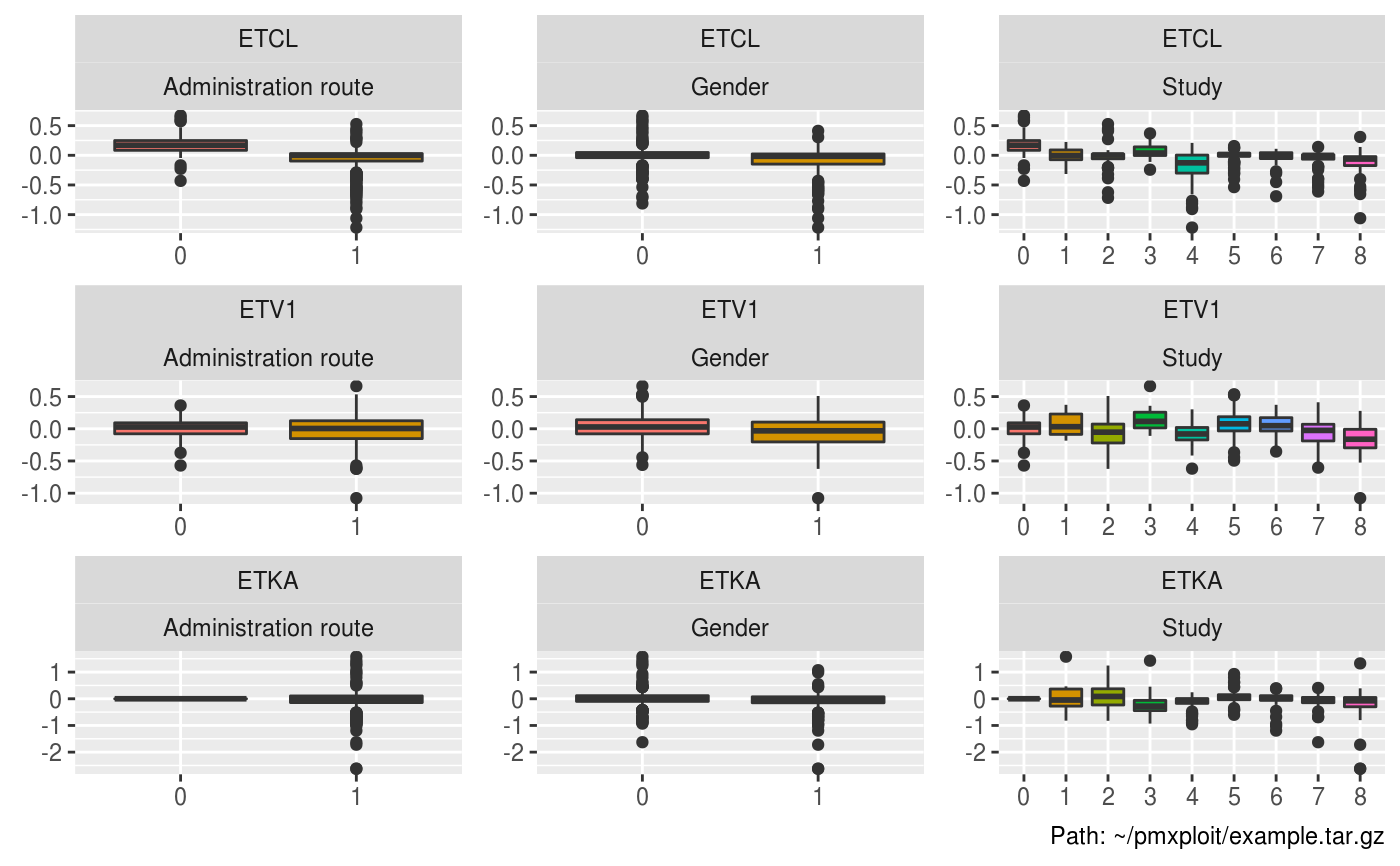
Plot parameters vs categorical covariates correlations
plot_parameters_vs_categorical_covariates.RdPlots the selected parameters and categorical covariates correlations.
plot_parameters_vs_categorical_covariates(run, parameters = NULL,
  covariates = NULL, baseline_only = TRUE, auto_legend = TRUE)
Arguments
| run |
|
|---|---|
| parameters | character vector of parameters names. Default is |
| covariates | character vector of categorical covariates names. Default is |
| baseline_only | logical. Consider only the baseline (= first) values of the subjects. Default is
|
| auto_legend | logical. When |
Value
A ggplot2 object.
Examples
EXAMPLERUN %>%
  plot_parameters_vs_categorical_covariates(parameters = c("ETCL", "ETV1", "ETKA"),
                                            covariates = c("ISC", "SEX", "STUD"))#> Warning: attributes are not identical across measure variables;
#> they will be dropped