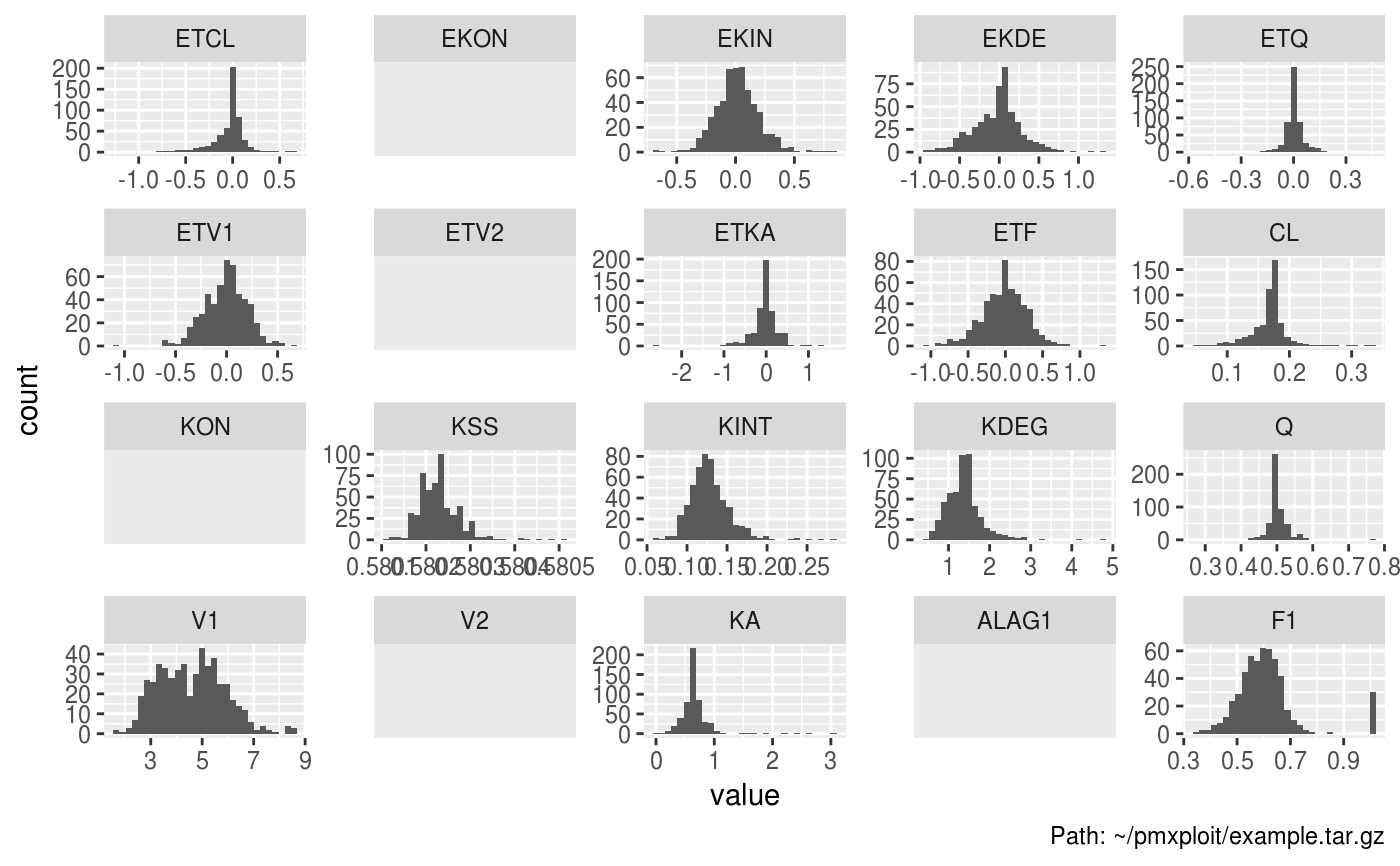
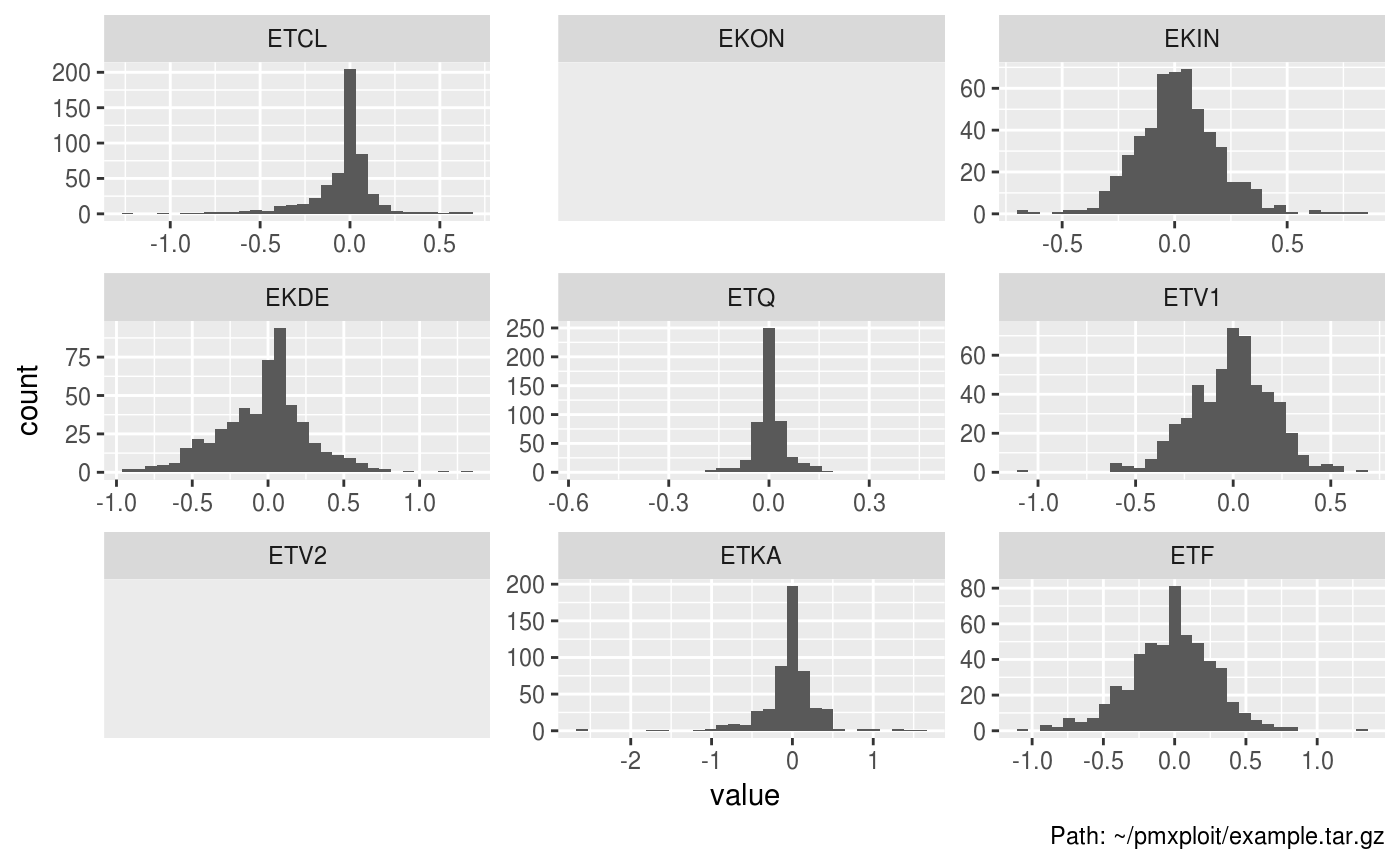
Individual parameters distributions
plot_parameters_distributions.RdPlots the distributions of the selected individual parameters.
plot_parameters_distributions(run, parameters = NULL,
  baseline_only = TRUE, type = "histogram", histogram_bins = 30L,
  histogram_empirical_density = FALSE,
  histogram_reference_distribution = list(fun = dnorm, args = list(mean =
  0, sd = 1)), qq_reference_distribution = list(fun = qnorm, args =
  list(mean = 0, sd = 1)), boxplot_facets = TRUE,
  boxplot_drop_unused = FALSE, facet_scales = "free",
  overlay_splits = TRUE, auto_legend = TRUE)
Arguments
| run |
|
|---|---|
| parameters | character vector of parameters names. Default is |
| baseline_only | logical. Consider only the baseline (= first) values of the subjects. Default is
|
| type | character. Type of distribution representation. One of
|
| histogram_bins | integer. If |
| boxplot_facets | logical. If |
| boxplot_drop_unused | logical. If |
| facet_scales | character. |
| overlay_splits | logical. If splitting is applied, |
| auto_legend | logical. When |
Value
A ggplot2 object.
Examples
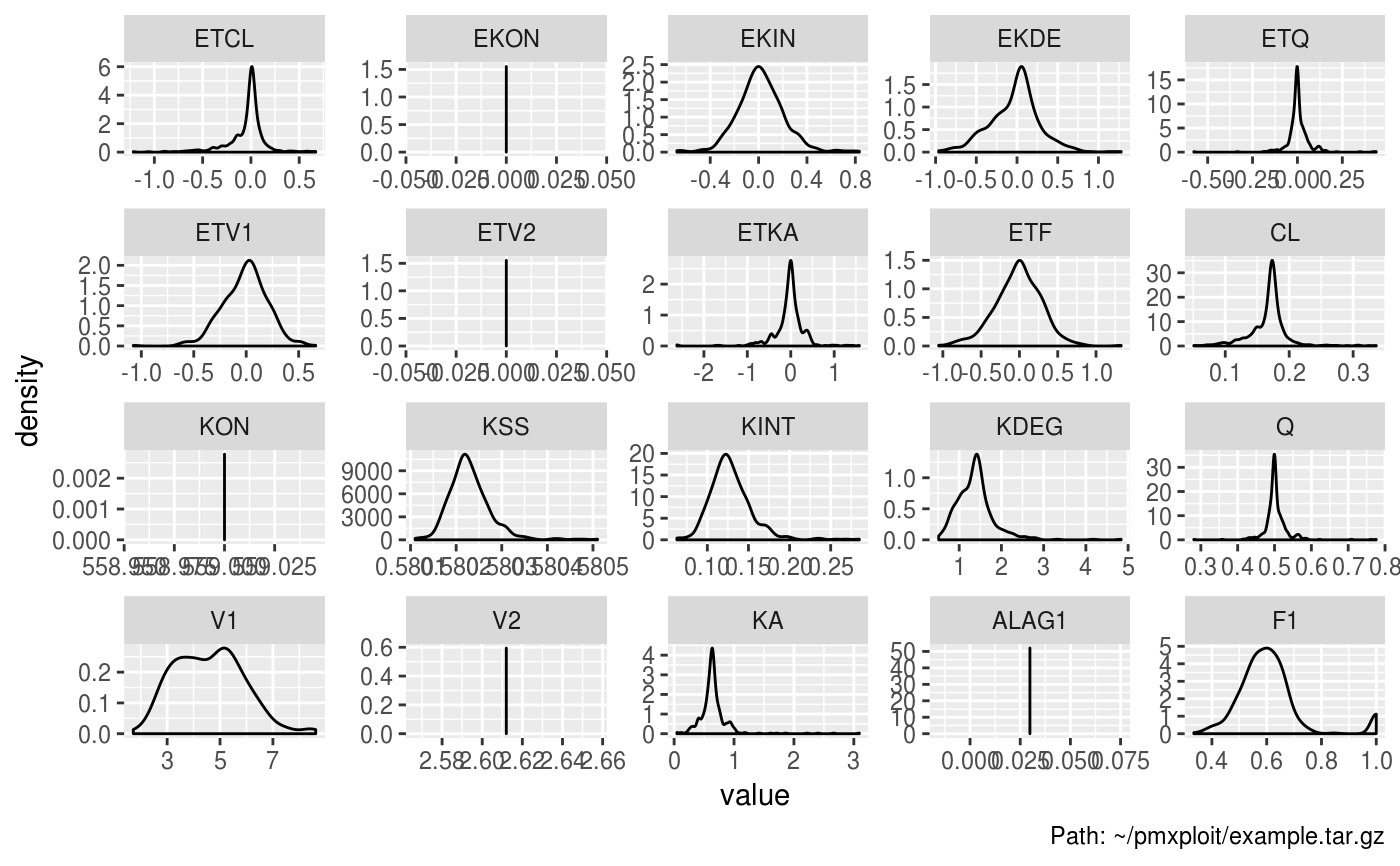
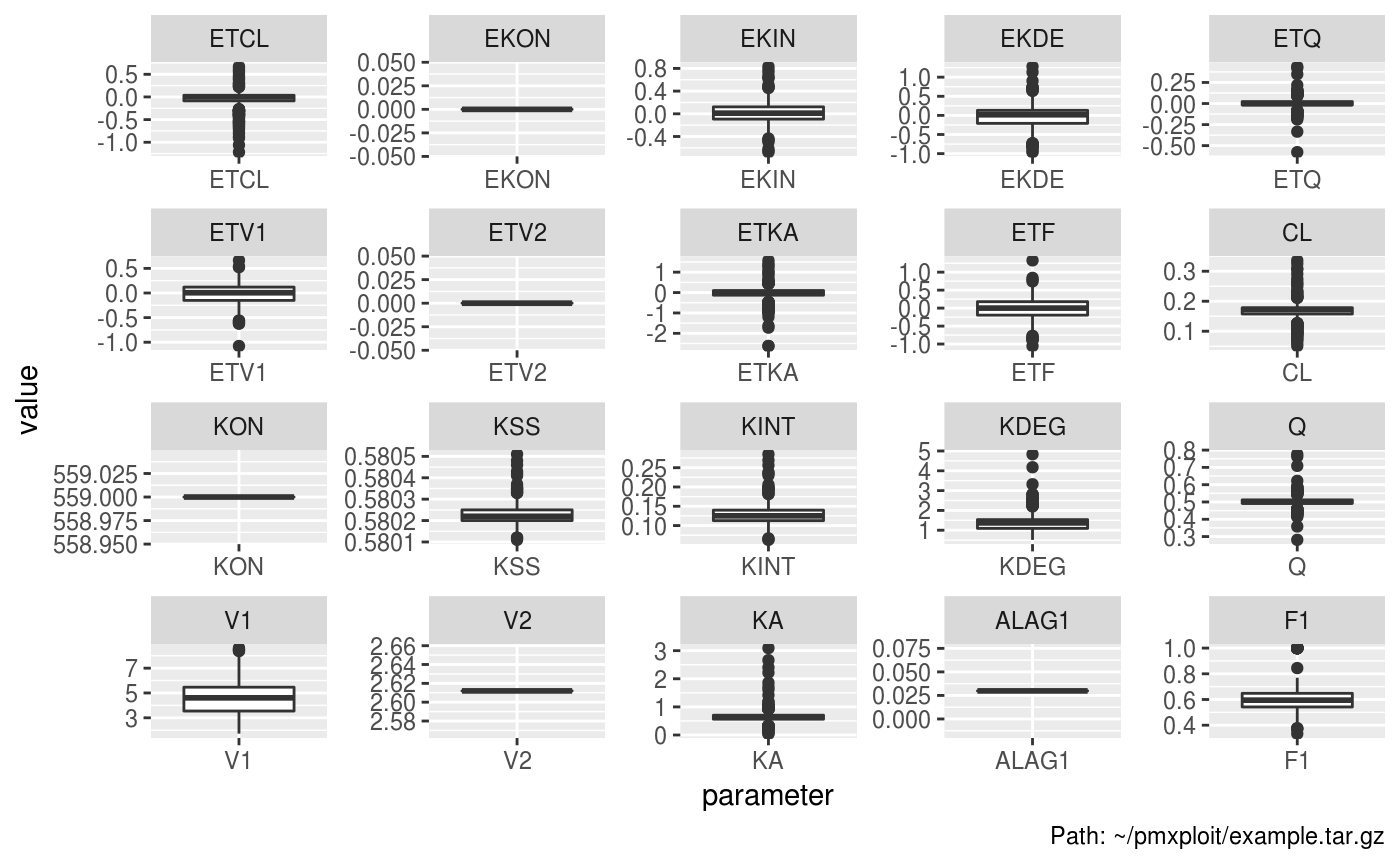
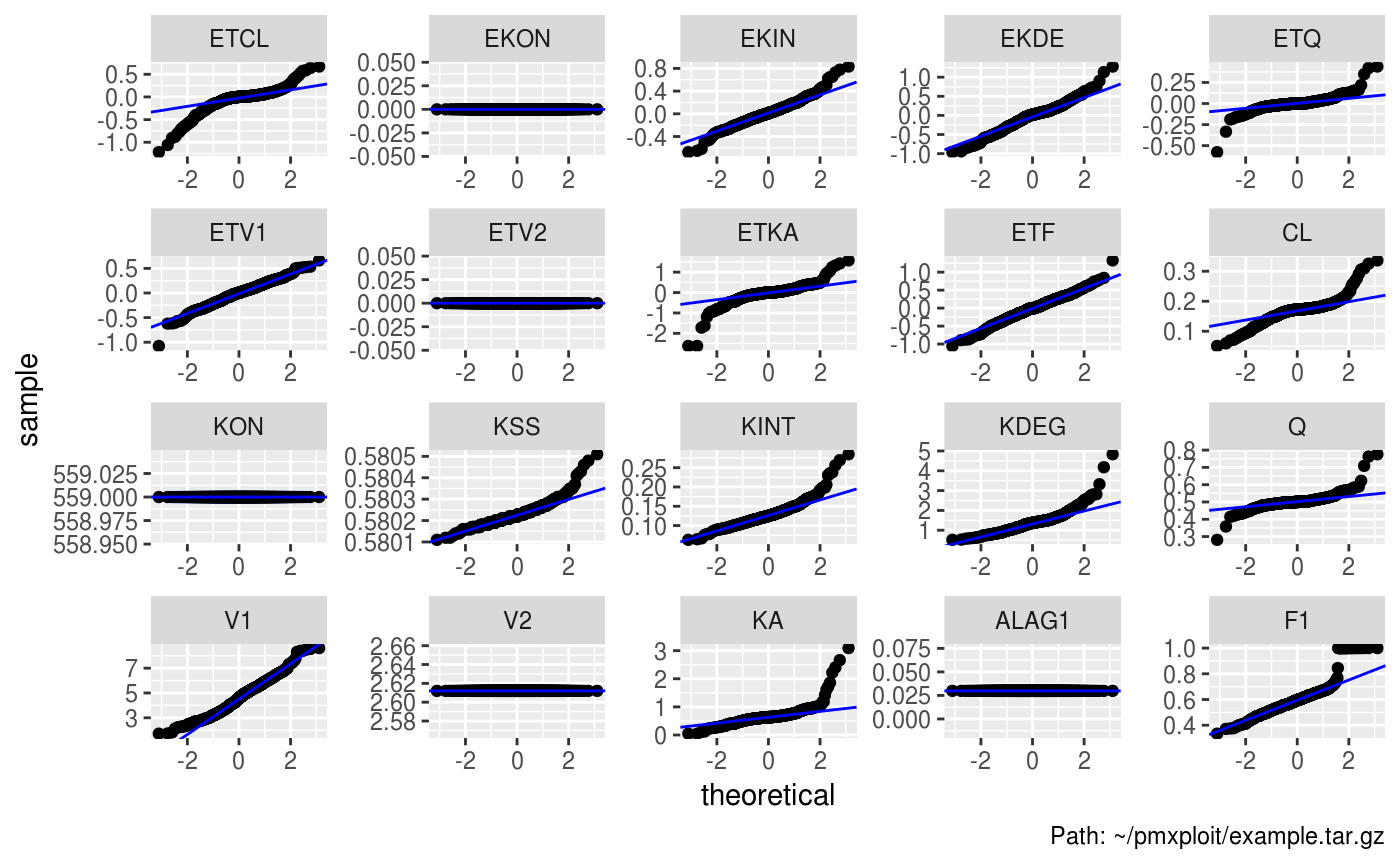
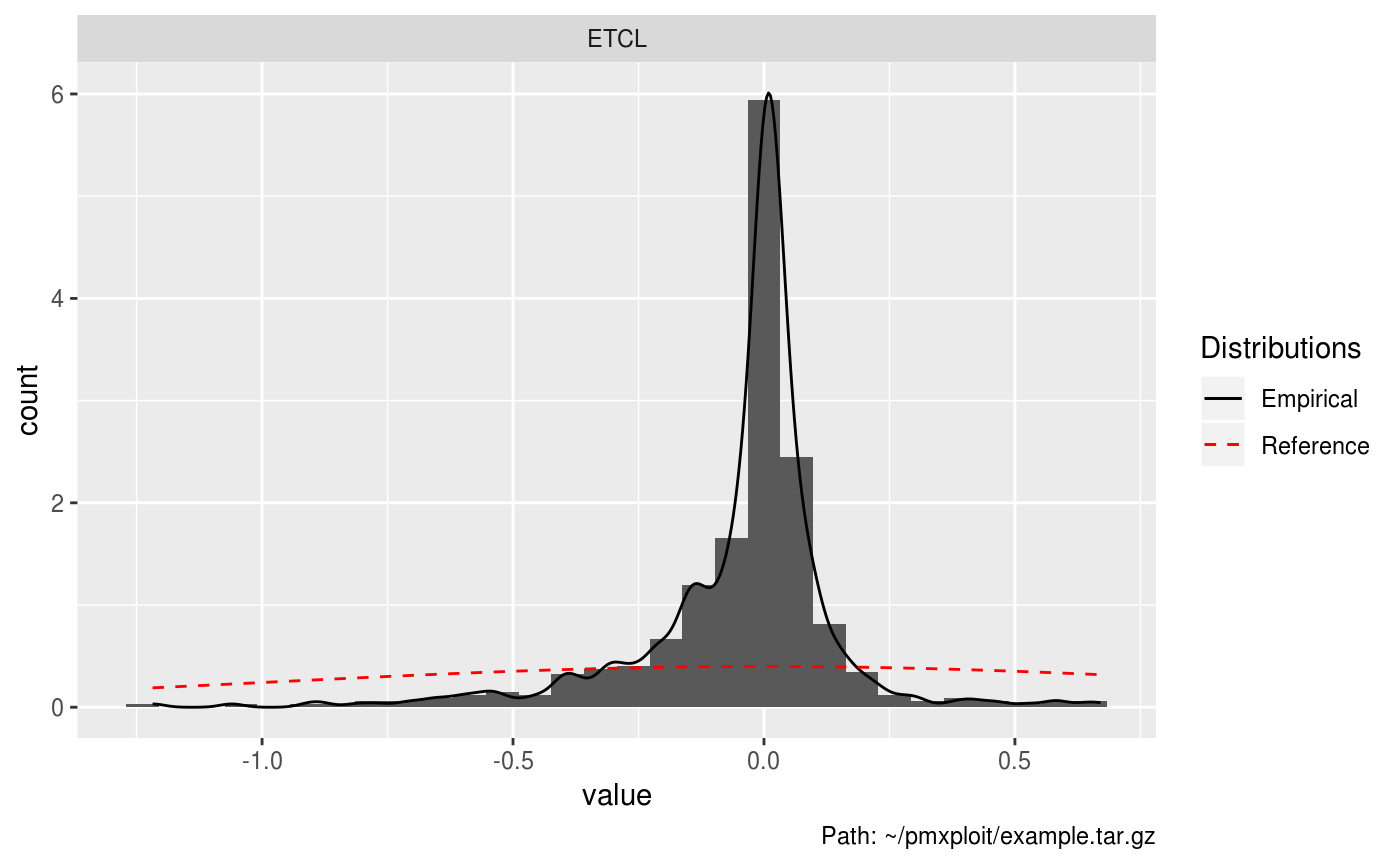
EXAMPLERUN %>% plot_parameters_distributions()#> Warning: Computation failed in `stat_bin()`: #> `binwidth` must be positive#> Warning: Computation failed in `stat_bin()`: #> `binwidth` must be positive#> Warning: Computation failed in `stat_bin()`: #> `binwidth` must be positive#> Warning: Computation failed in `stat_bin()`: #> `binwidth` must be positive#> Warning: Computation failed in `stat_bin()`: #> `binwidth` must be positiveEXAMPLERUN %>% plot_parameters_distributions(type = "density")EXAMPLERUN %>% plot_parameters_distributions(type = "boxplot")EXAMPLERUN %>% plot_parameters_distributions(type = "qq")EXAMPLERUN %>% plot_parameters_distributions(parameters = "eta")#> Warning: Computation failed in `stat_bin()`: #> `binwidth` must be positive#> Warning: Computation failed in `stat_bin()`: #> `binwidth` must be positiveEXAMPLERUN %>% plot_parameters_distributions(parameters = "ETCL", histogram_empirical_density = TRUE, histogram_reference_distribution = list(fun = dnorm, args = list(mean = 0, sd = 1)))