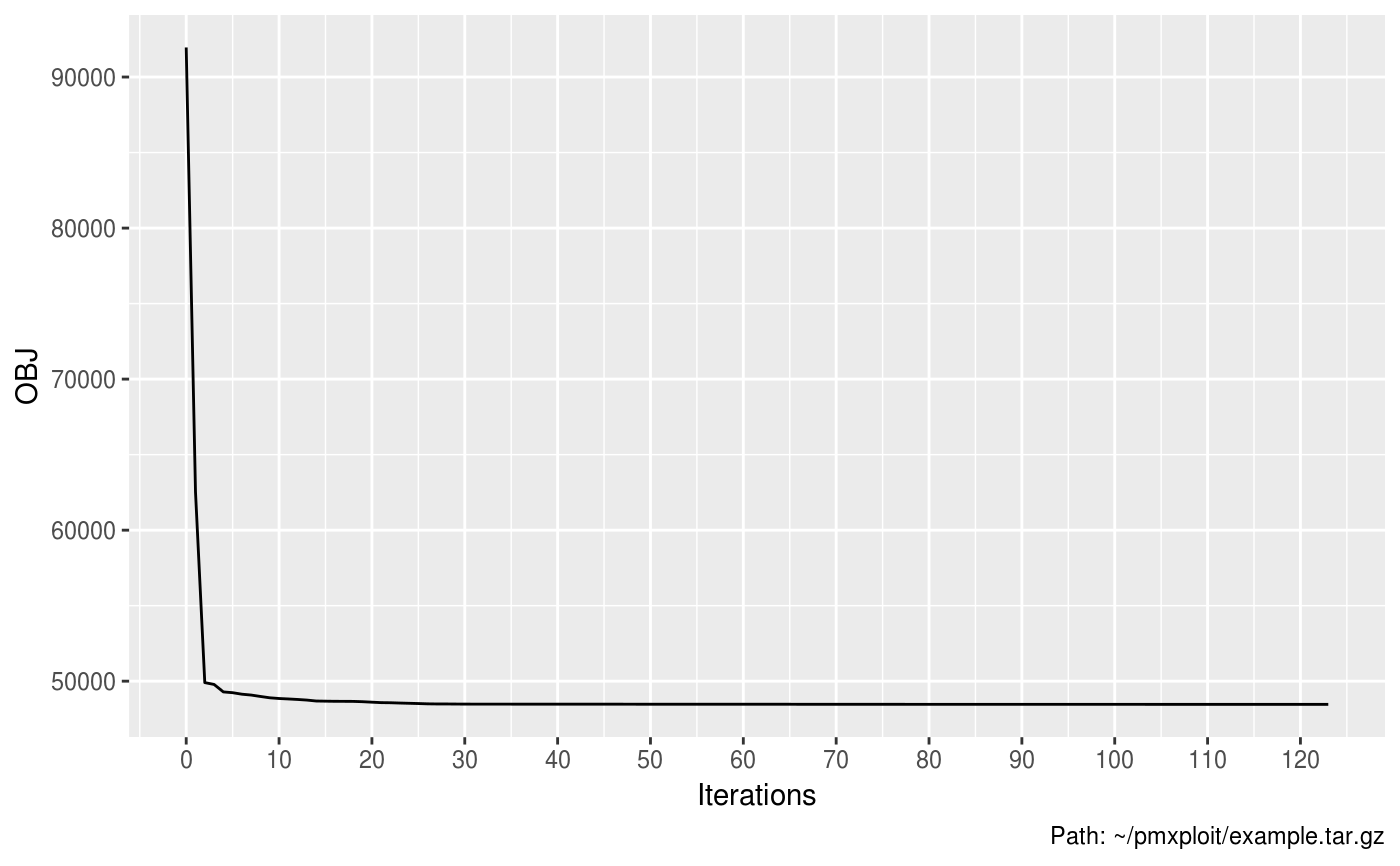
Objective function plot
plot_ofv.RdPlots the value, at each printed out iteration, of objective function during an estimation step.
plot_ofv(run, estimation_number = NULL, auto_legend = TRUE)
Arguments
| run |
|
|---|---|
| estimation_number | integer. Number of the estimation step. Default is
|
| auto_legend | logical. When |
Value
A ggplot2 object.
Examples
EXAMPLERUN %>% plot_ofv()EXAMPLERUN %>% plot_ofv(estimation_number = 1)