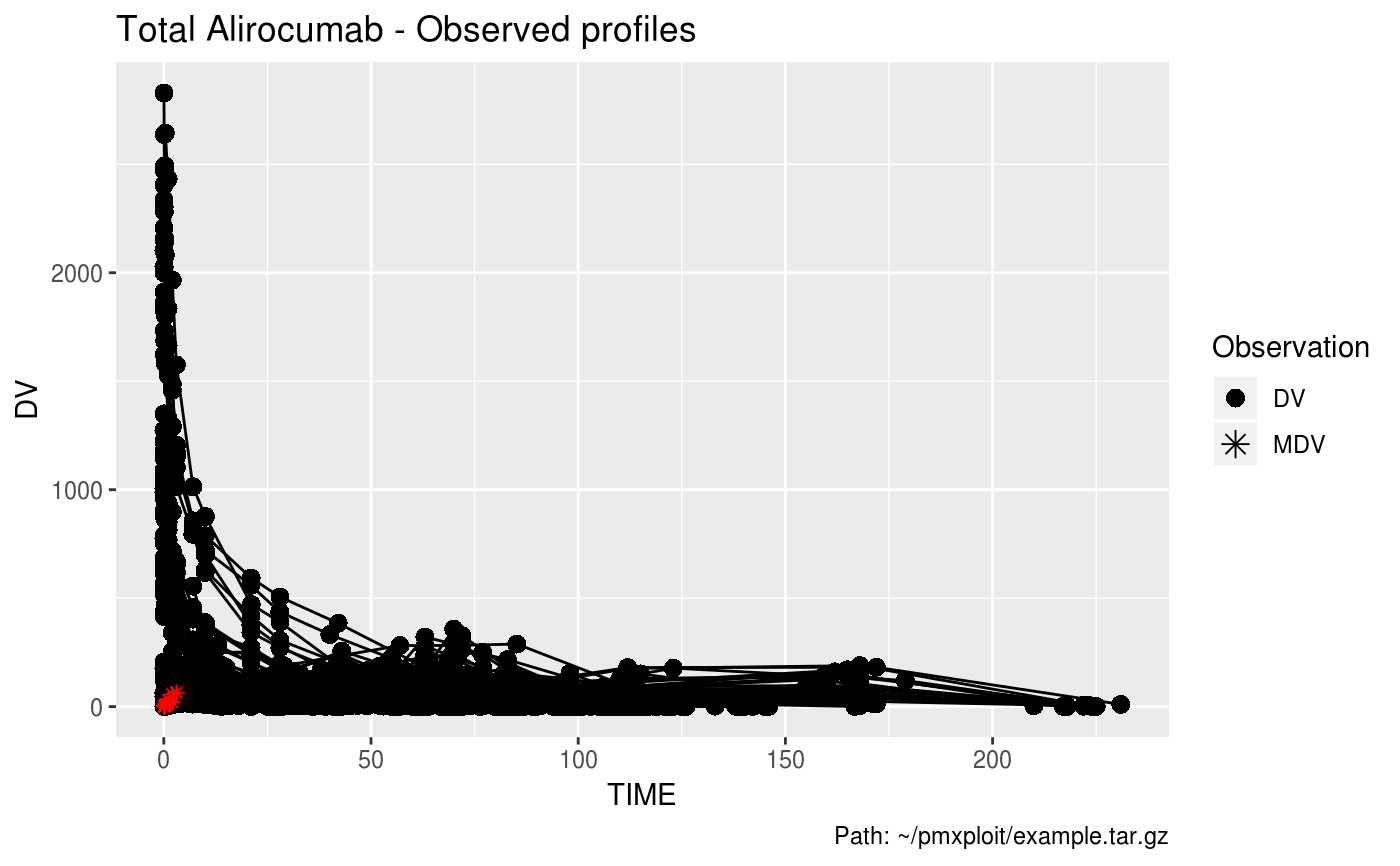
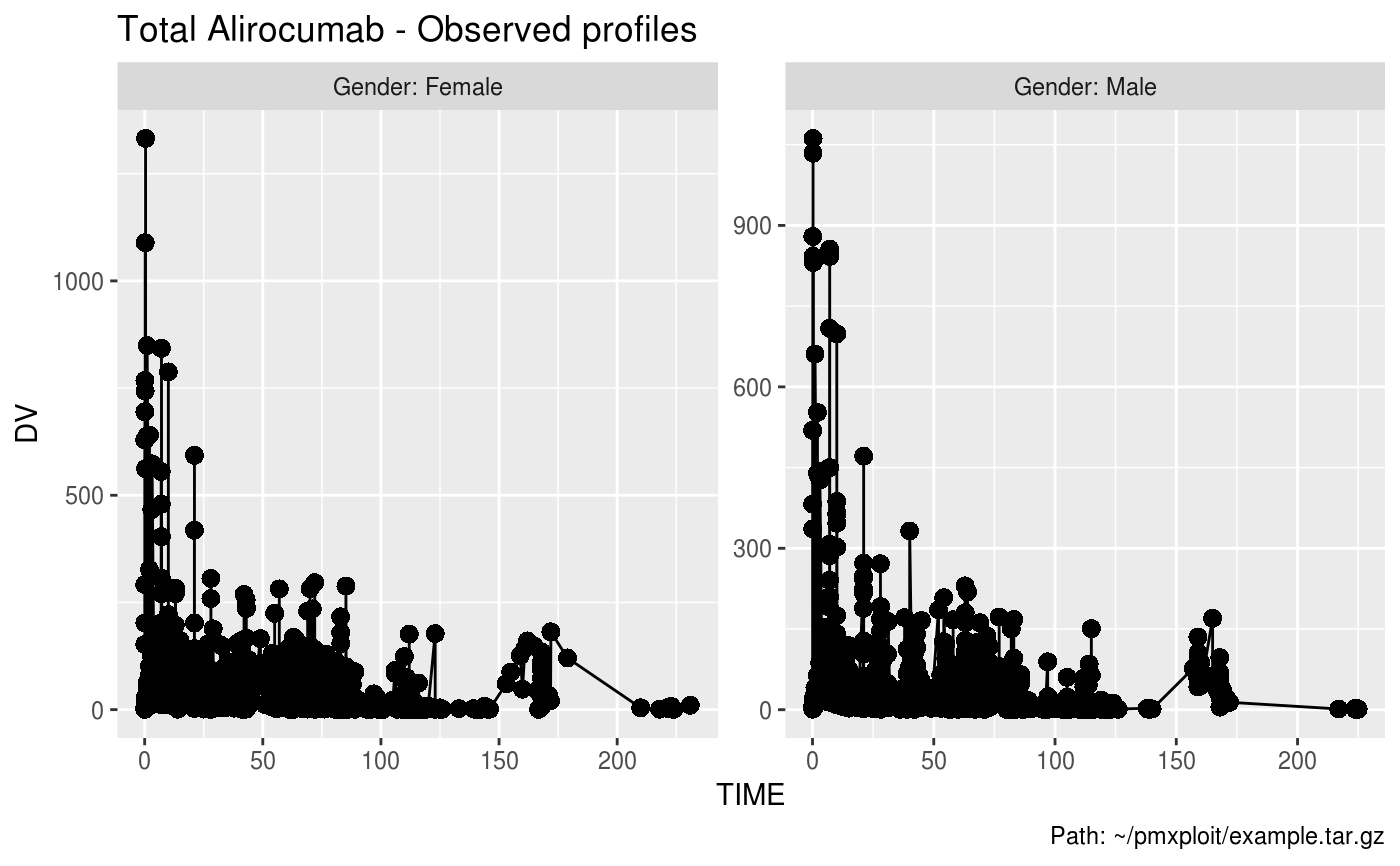
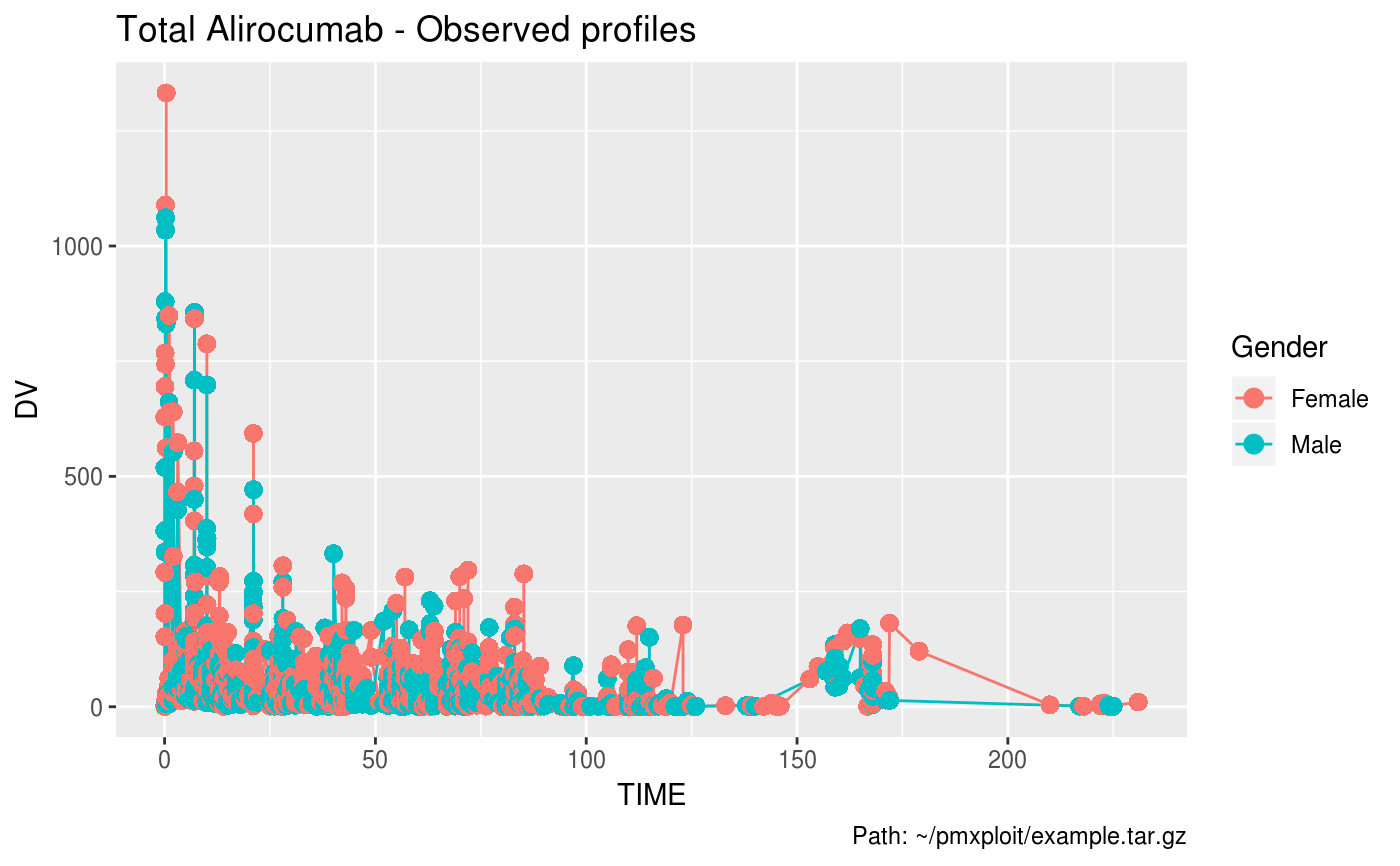
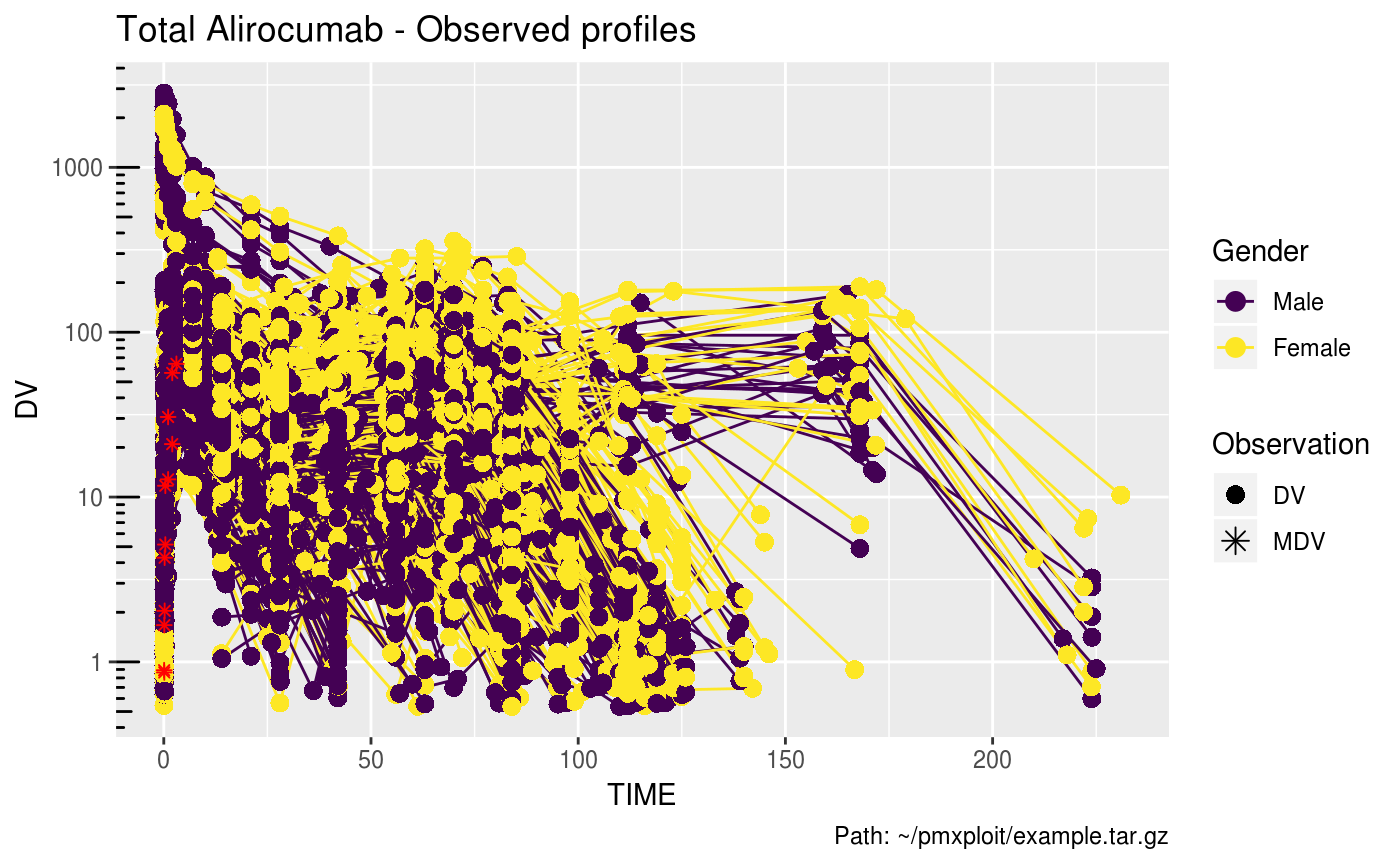
Spaghetti plot
plot_observed_profiles.RdPlot of observed profiles versus an independent variable (e.g. TIME or TAD).
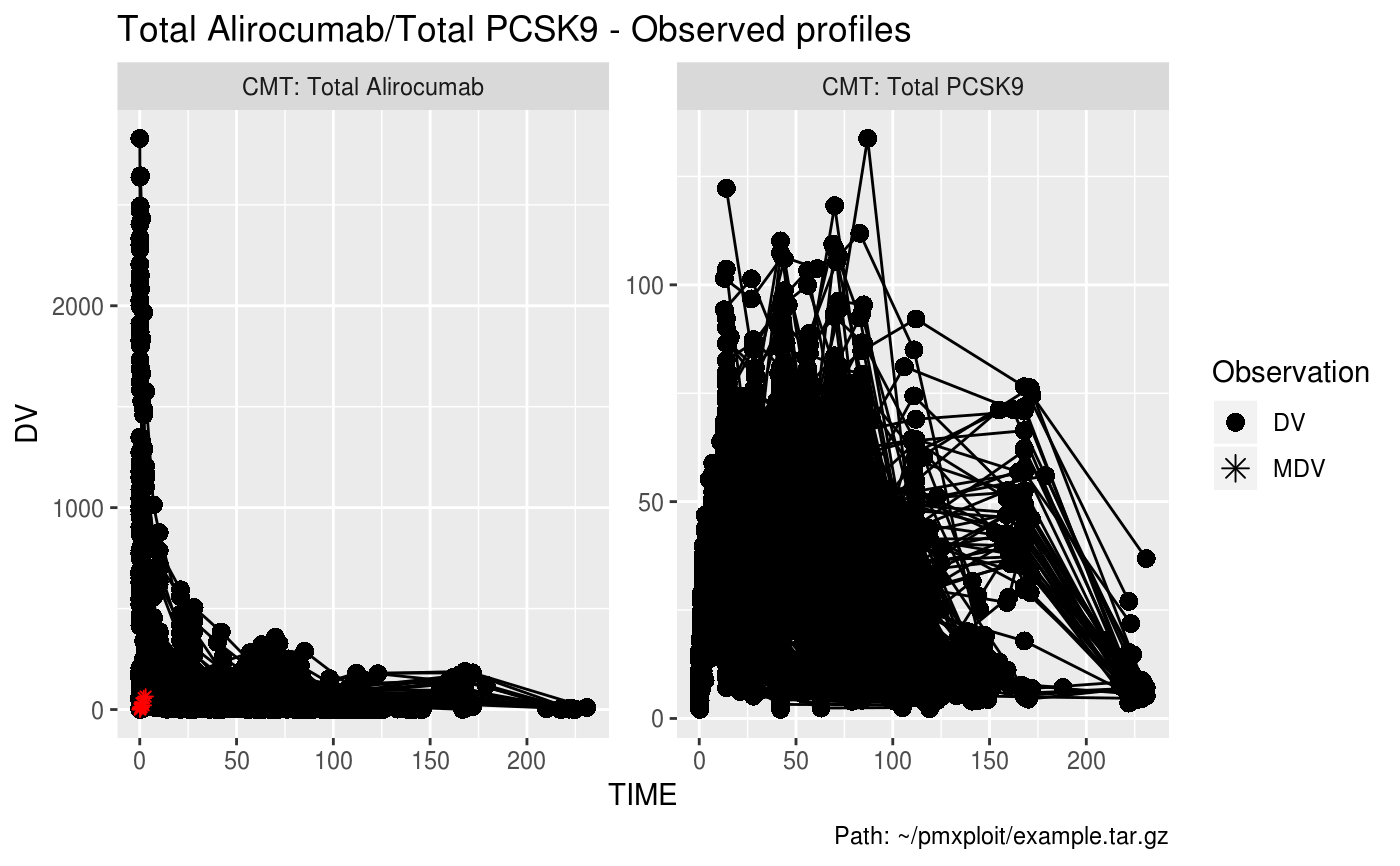
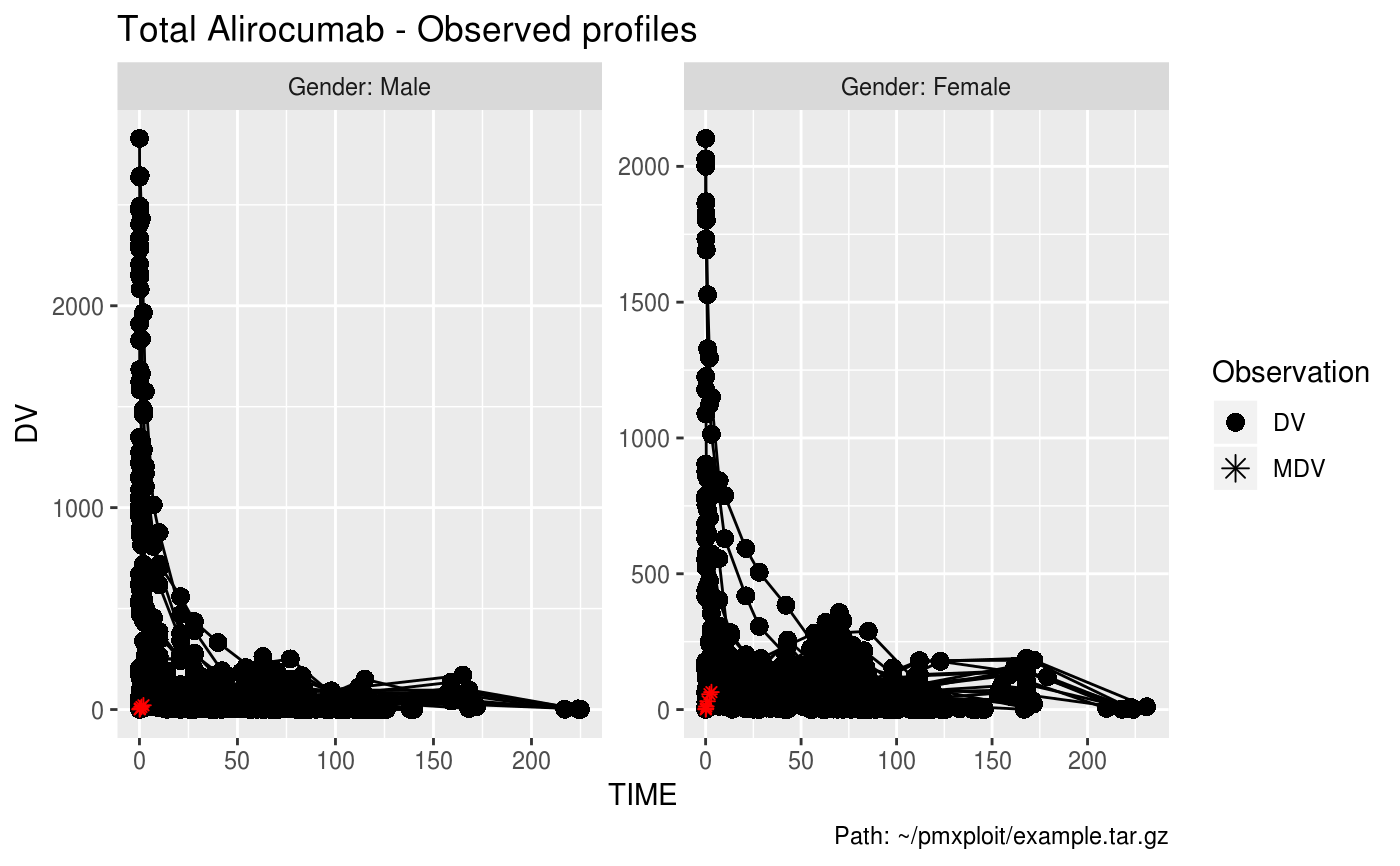
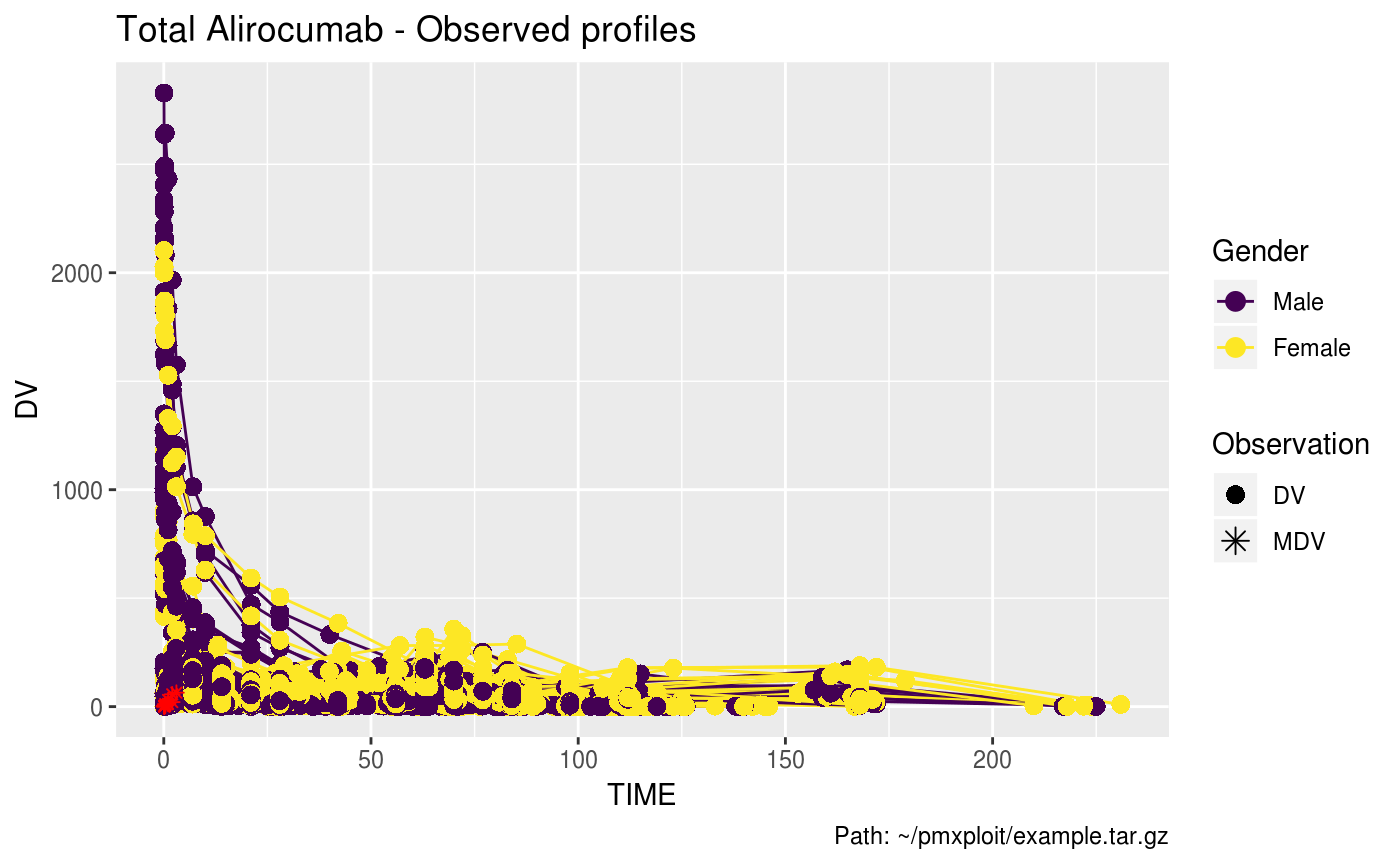
plot_observed_profiles(run, compartment = NULL, idv = "TIME",
  ids = NULL, show_mdv = TRUE, log_dv = FALSE,
  mean_profiles = FALSE, x_scale = "linear", y_scale = "linear",
  logticks_annotation = TRUE, facetted = TRUE, facet_scales = "free",
  transparency = FALSE, auto_legend = TRUE)
Arguments
| run |
|
|---|---|
| compartment | integer. Number of the compartment of the dependent variable. |
| idv | character. Name of the column used as independent variable. Default is
|
| ids | integer vector of the IDs of the individuals to plot. Default is
|
| log_dv | logical. Set it to |
| mean_profiles | logical. If |
| x_scale | character. X-axis scale, one of |
| y_scale | character. Y-axis scale, one of |
| logticks_annotation | logical. If |
| facetted | logical. If |
| facet_scales | character. |
| transparency | logical. Plot scatterplot dots with transparency, useful to avoid overplotting with large datasets. Default is FALSE.#' |
| auto_legend | logical. When |
Value
A ggplot2 object.
Examples
EXAMPLERUN %>% plot_observed_profiles(compartment = 2)EXAMPLERUN %>% group_by(SEX) %>% plot_observed_profiles(compartment = 2, mean_profiles = TRUE, facetted = FALSE)EXAMPLERUN %>% group_by(SEX) %>% plot_observed_profiles(compartment = 2, y_scale = "log", facetted = FALSE)