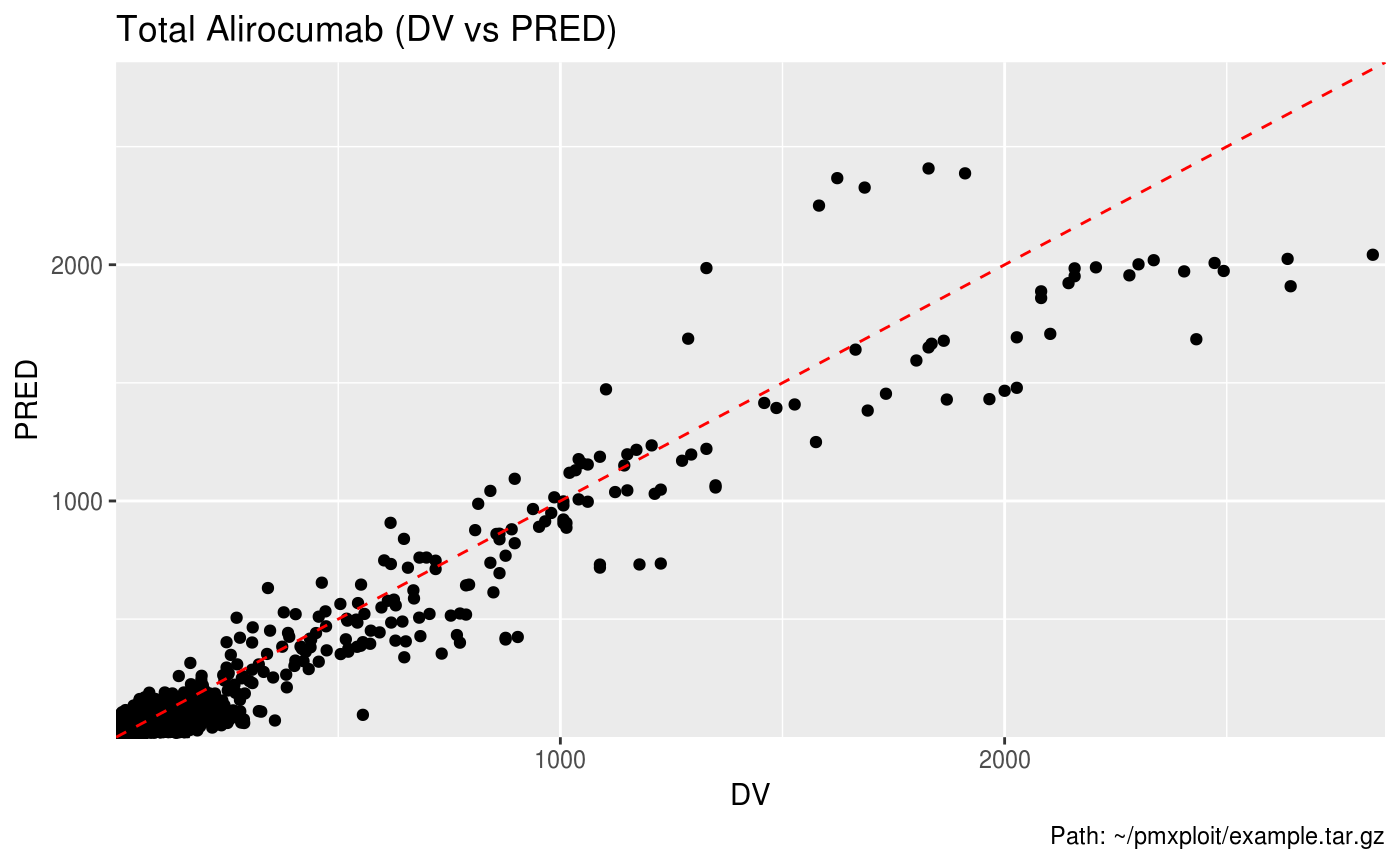
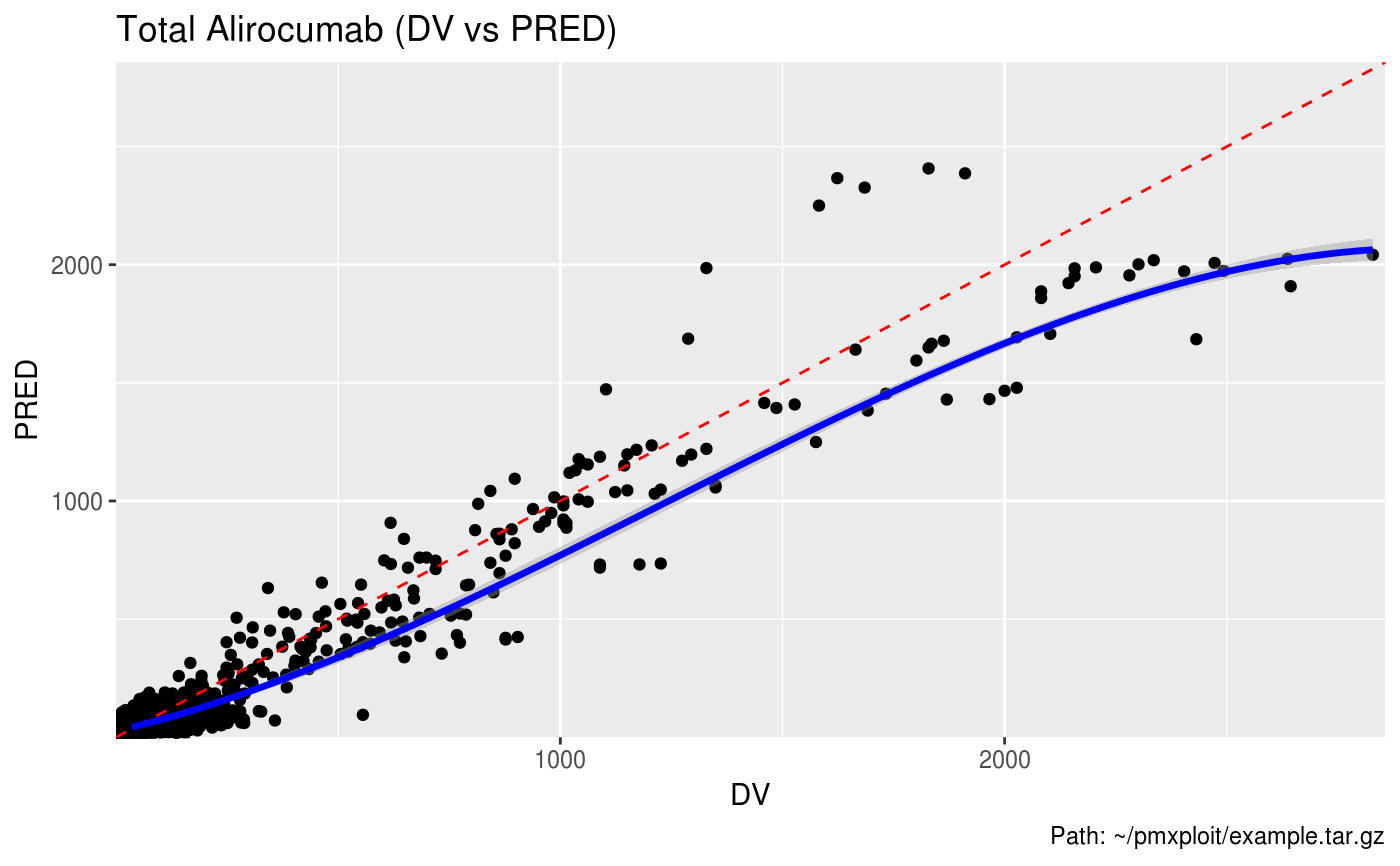
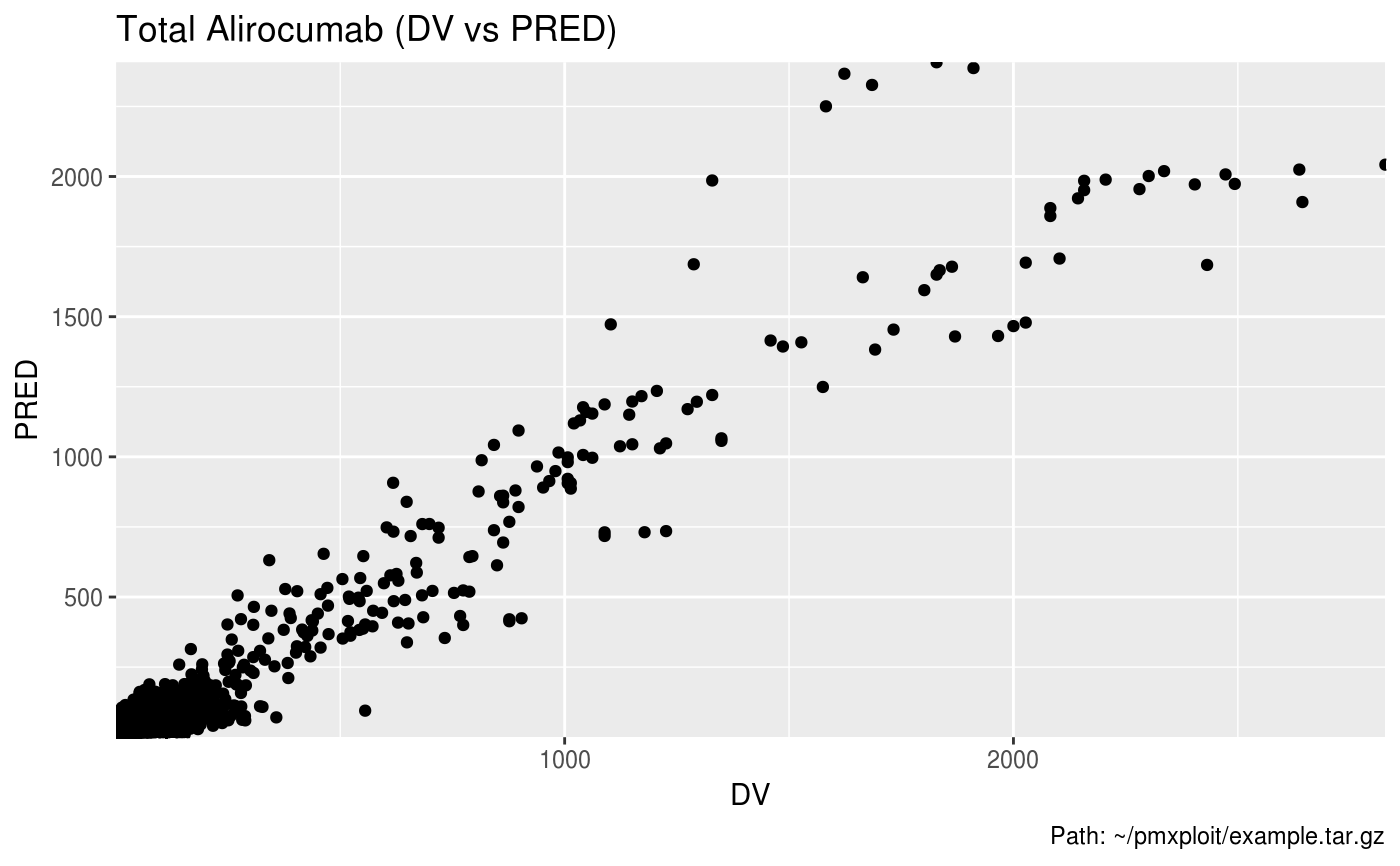
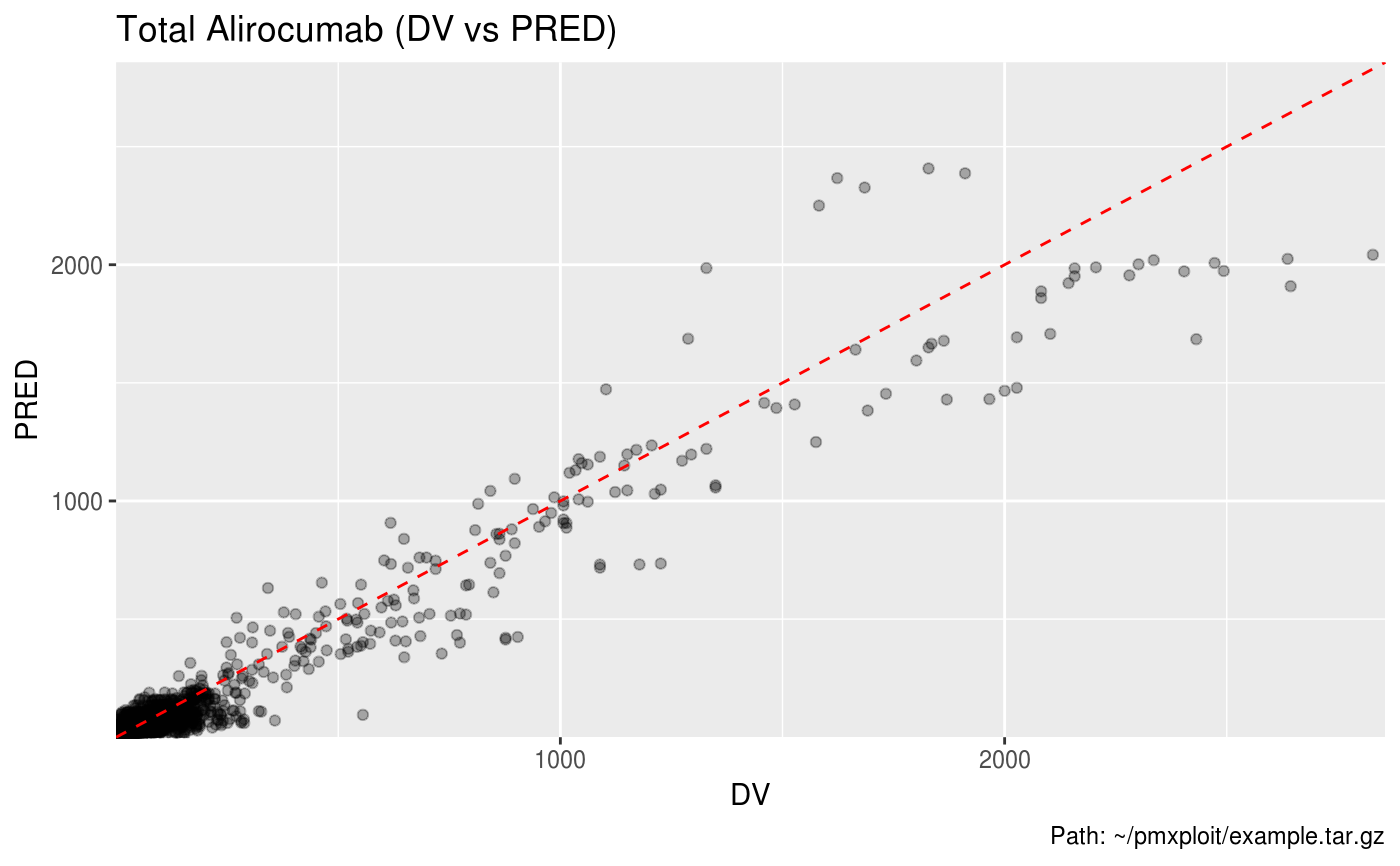
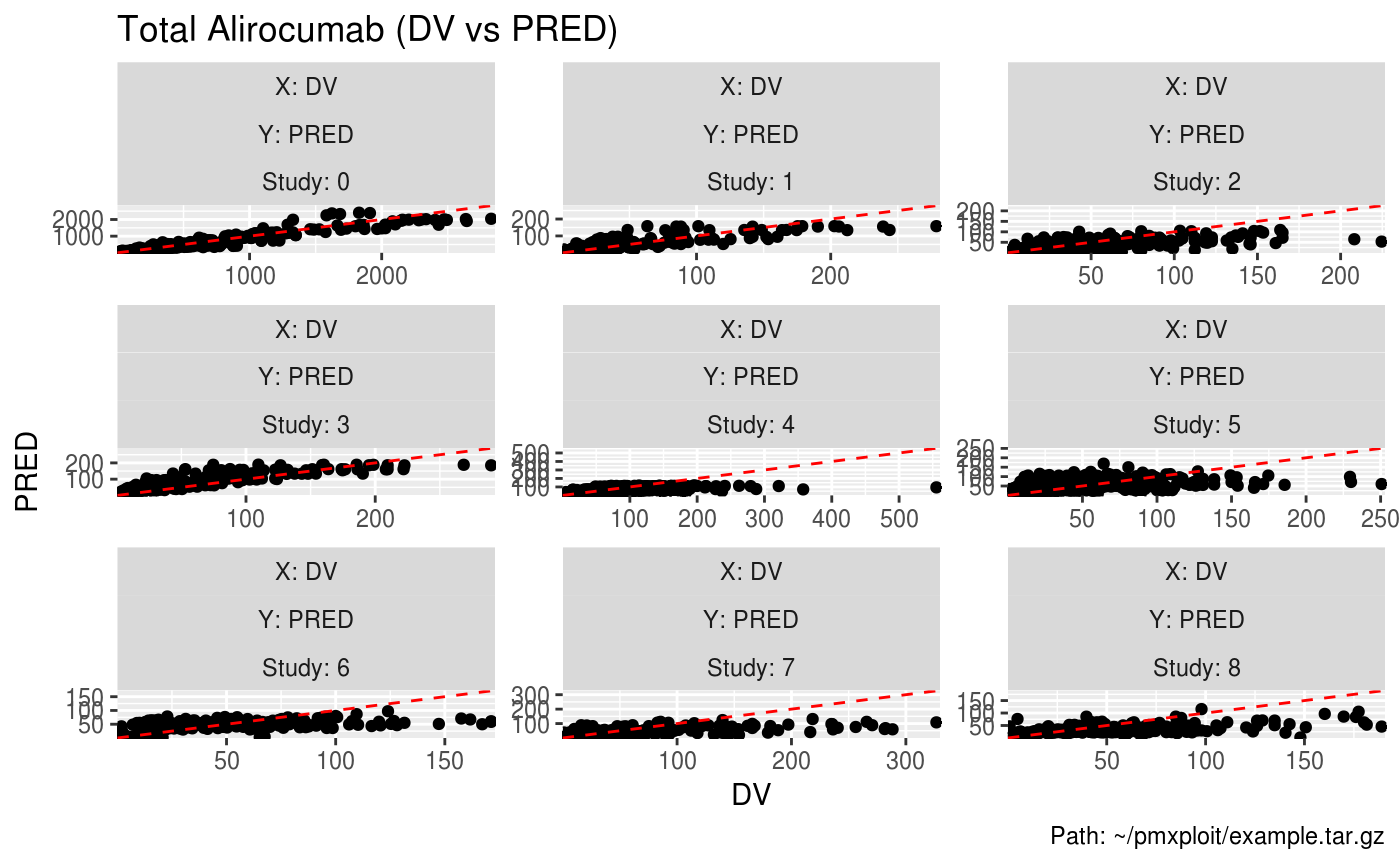
Dependent variables vs Predictions plot
plot_dv_vs_predictions.RdDependent variables vs Predictions plot
plot_dv_vs_predictions(run = NULL, compartment = NULL, dv = "DV",
  predictions = "PRED", log_dv = FALSE, facetted = TRUE,
  smoothing_method = NULL, smoothing_se = TRUE, identity_line = TRUE,
  x_scale = "linear", y_scale = "linear", logticks_annotation = TRUE,
  facet_scales = "free", transparency = FALSE,
  keep_time_zero = FALSE, auto_legend = TRUE)
Arguments
| run |
|
|---|---|
| compartment | integer. Number of the compartment of the dependent variable. |
| dv | character. Name of the dependent variable column in the output tables.
Default is |
| predictions | character vector. Name of the predictions column(s) in the
dataset. Default is |
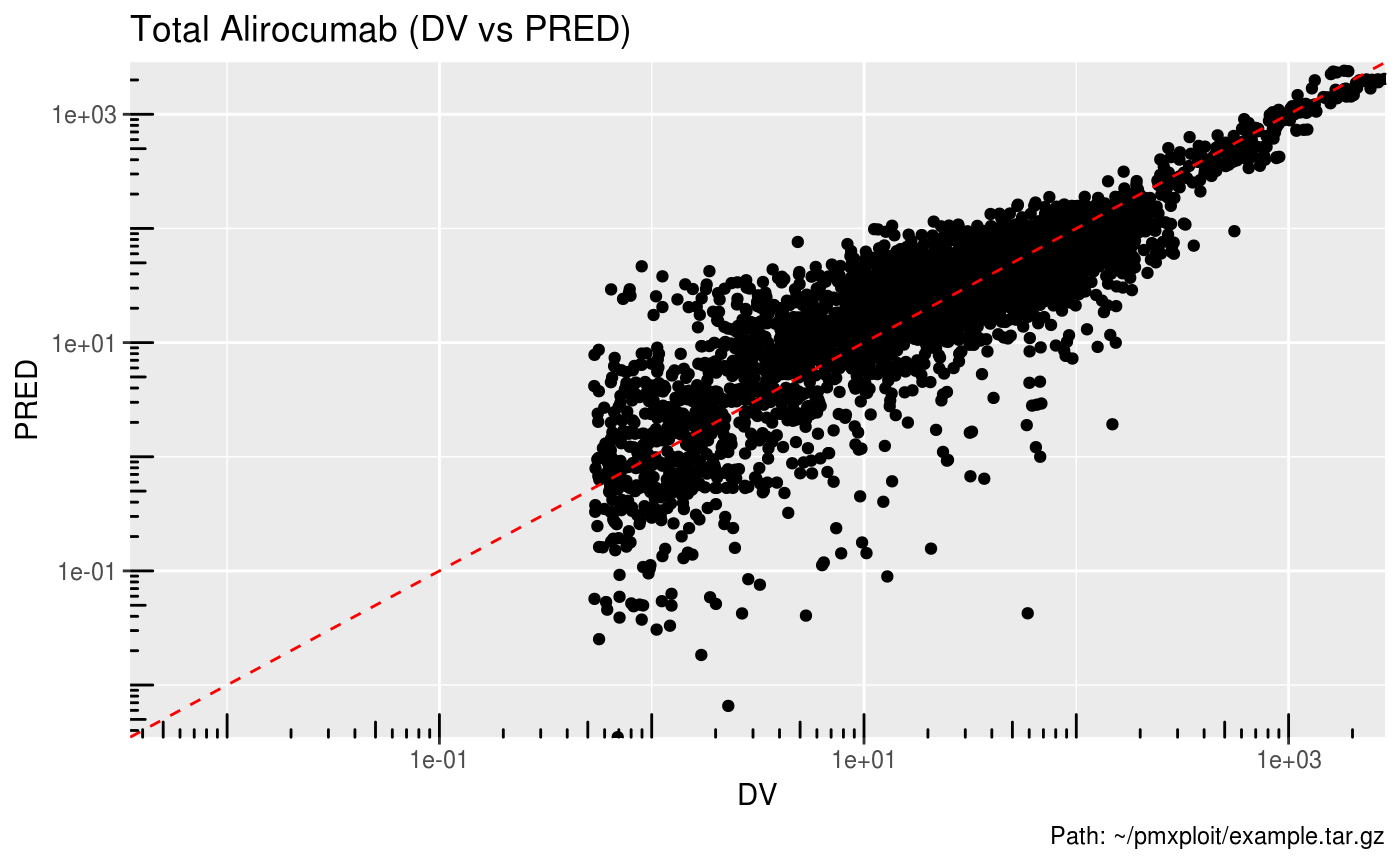
| log_dv | logical. Set it to |
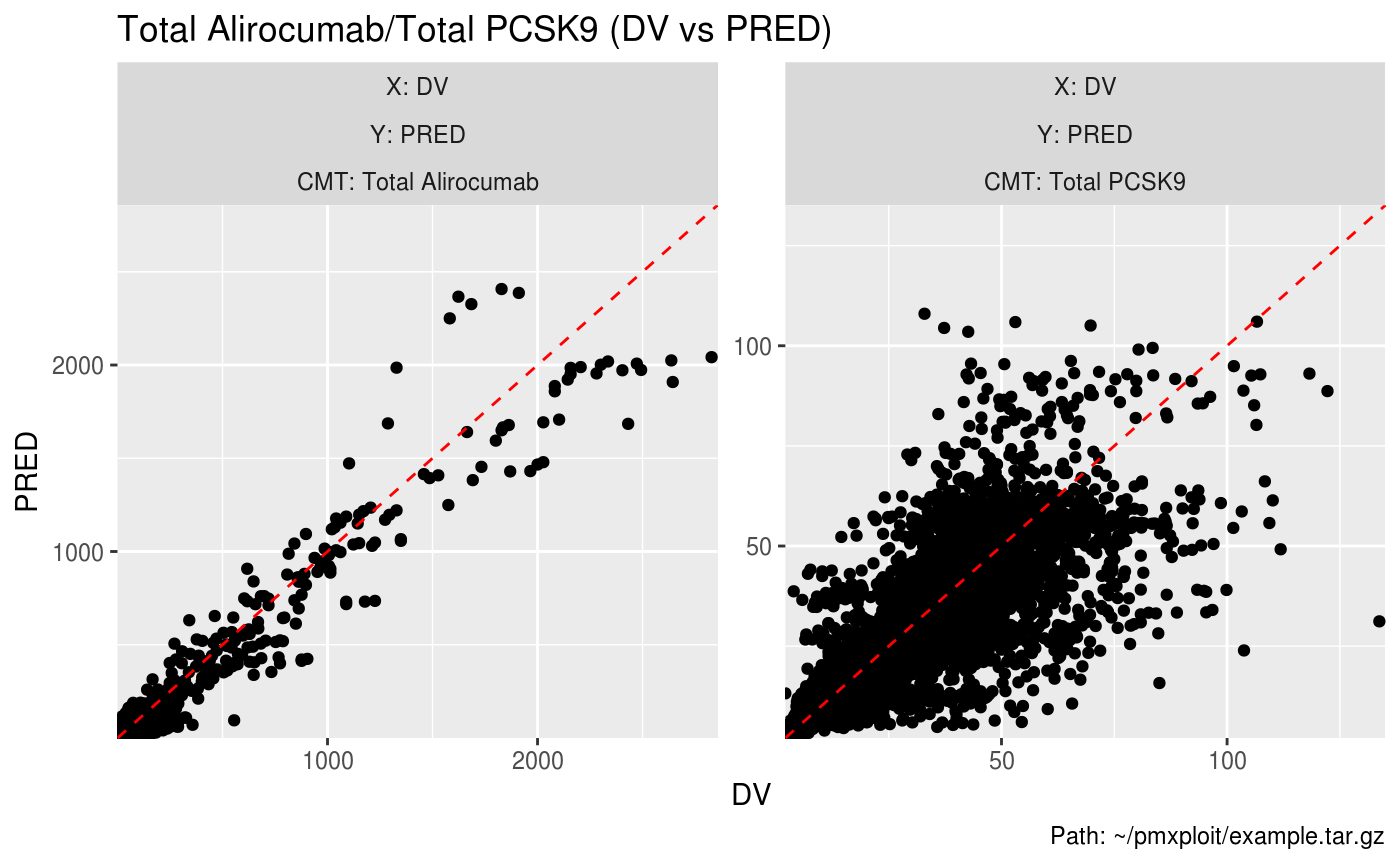
| facetted | logical. If |
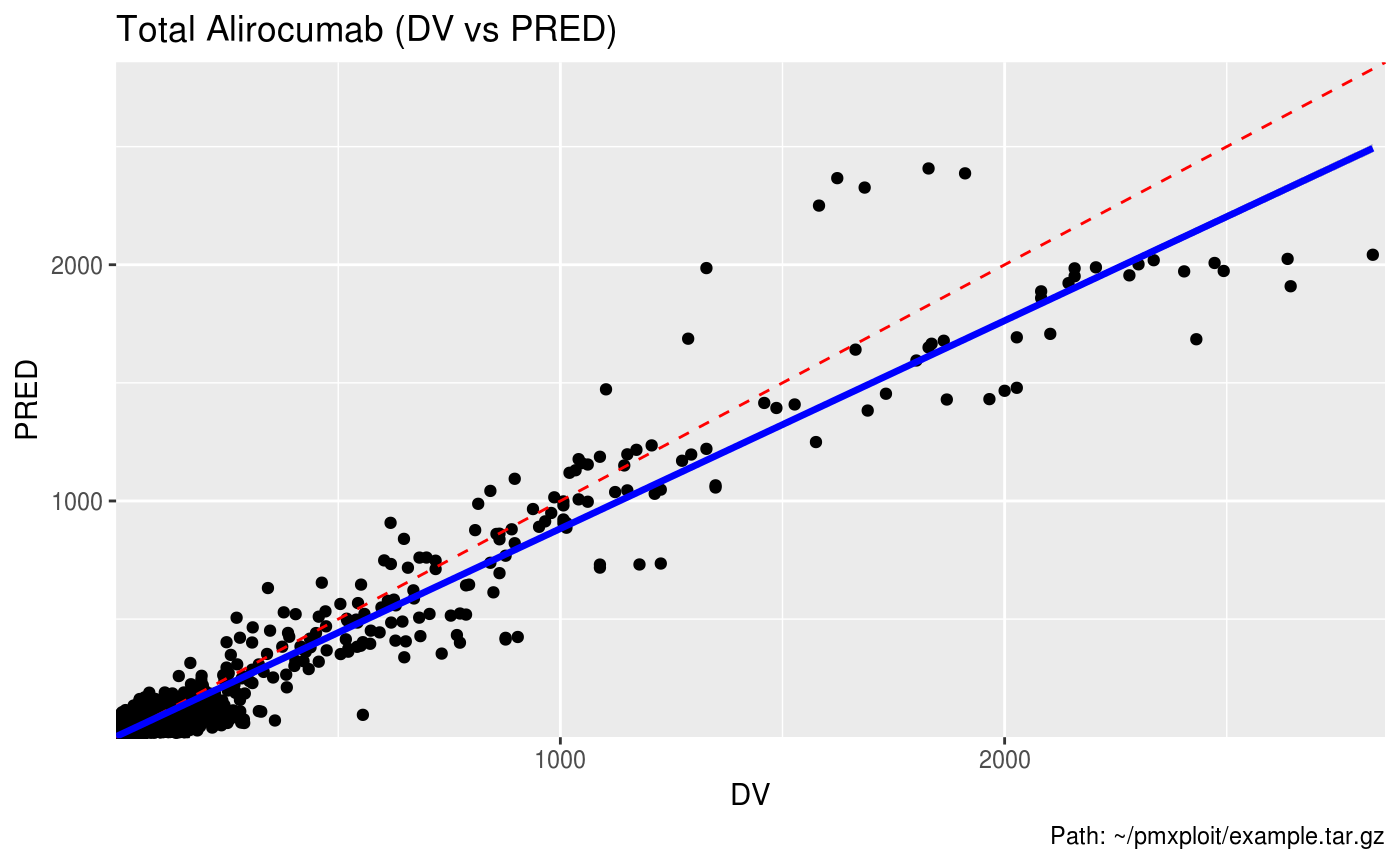
| smoothing_method | character. |
| smoothing_se | logical. Display confidence interval around smooth? |
| identity_line | logical. Draws an identity line. Default is |
| x_scale | character. X-axis scale, one of |
| y_scale | character. Y-axis scale, one of |
| logticks_annotation | logical. If |
| facet_scales | character. |
| transparency | logical. Plot scatterplot dots with transparency, useful to avoid overplotting with large datasets. Default is FALSE.#' |
| keep_time_zero | logical. If |
| auto_legend | logical. When |
| split_by | character vector. Name of categorical covariates used to split the data. |
Value
A ggplot2 object.
Examples
EXAMPLERUN %>% plot_dv_vs_predictions(compartment = 2, predictions = "PRED")EXAMPLERUN %>% plot_dv_vs_predictions(compartment = 2, predictions = "PRED", x_scale = "log", y_scale = "log")EXAMPLERUN %>% plot_dv_vs_predictions(compartment = 2, predictions = "PRED", smoothing_method = "lm")#> Warning: Removed 1 rows containing non-finite values (stat_smooth).#> Warning: Removed 1 rows containing missing values (geom_point).EXAMPLERUN %>% plot_dv_vs_predictions(compartment = 2, predictions = "PRED", smoothing_method = "loess")#> Warning: Removed 1 rows containing non-finite values (stat_smooth).#> Warning: Removed 1 rows containing missing values (geom_point).#> Warning: Removed 1 rows containing missing values (geom_smooth).EXAMPLERUN %>% plot_dv_vs_predictions(compartment = 2, predictions = "PRED", identity_line = FALSE)EXAMPLERUN %>% plot_dv_vs_predictions(compartment = 2, predictions = "PRED", transparency = TRUE)