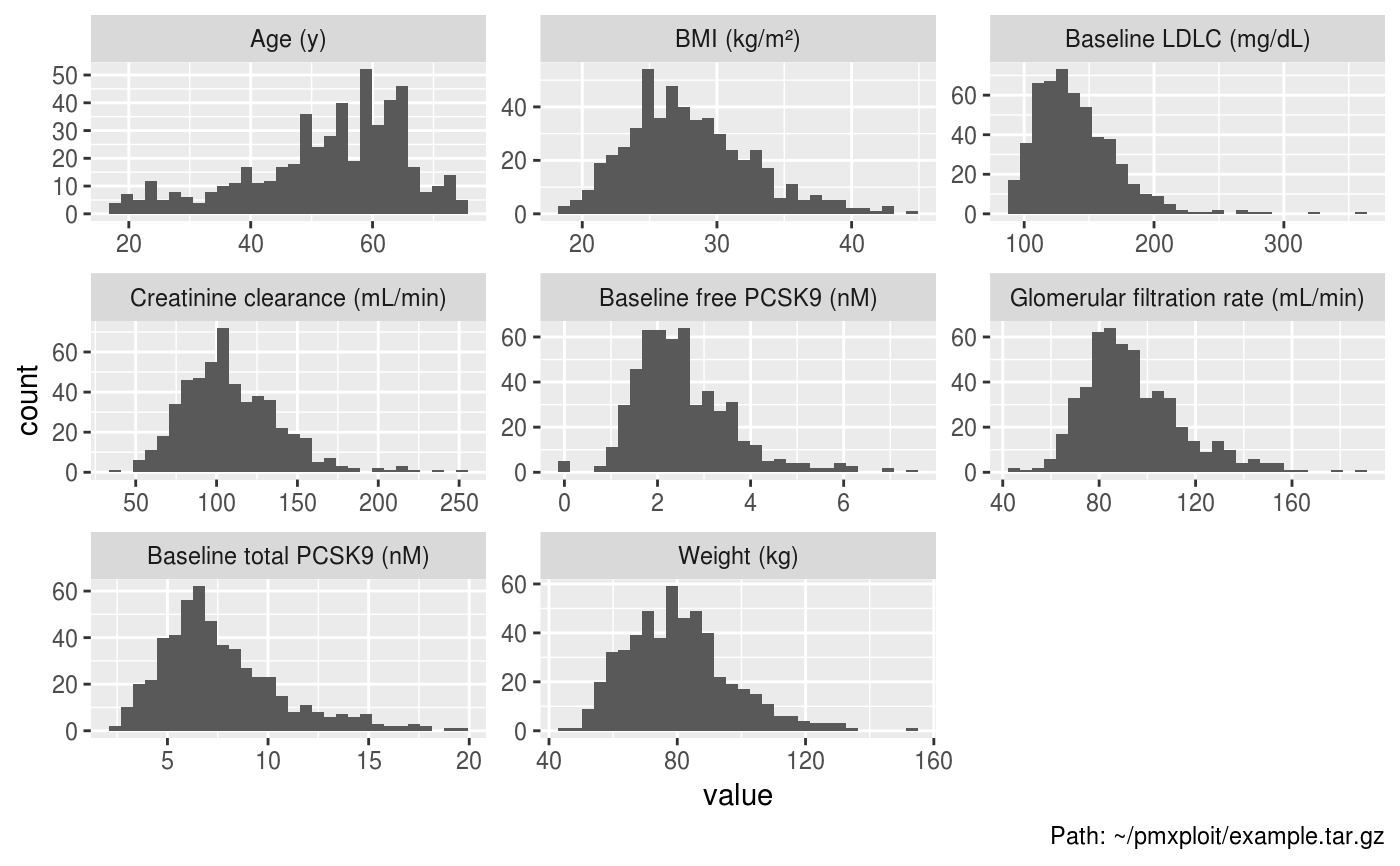
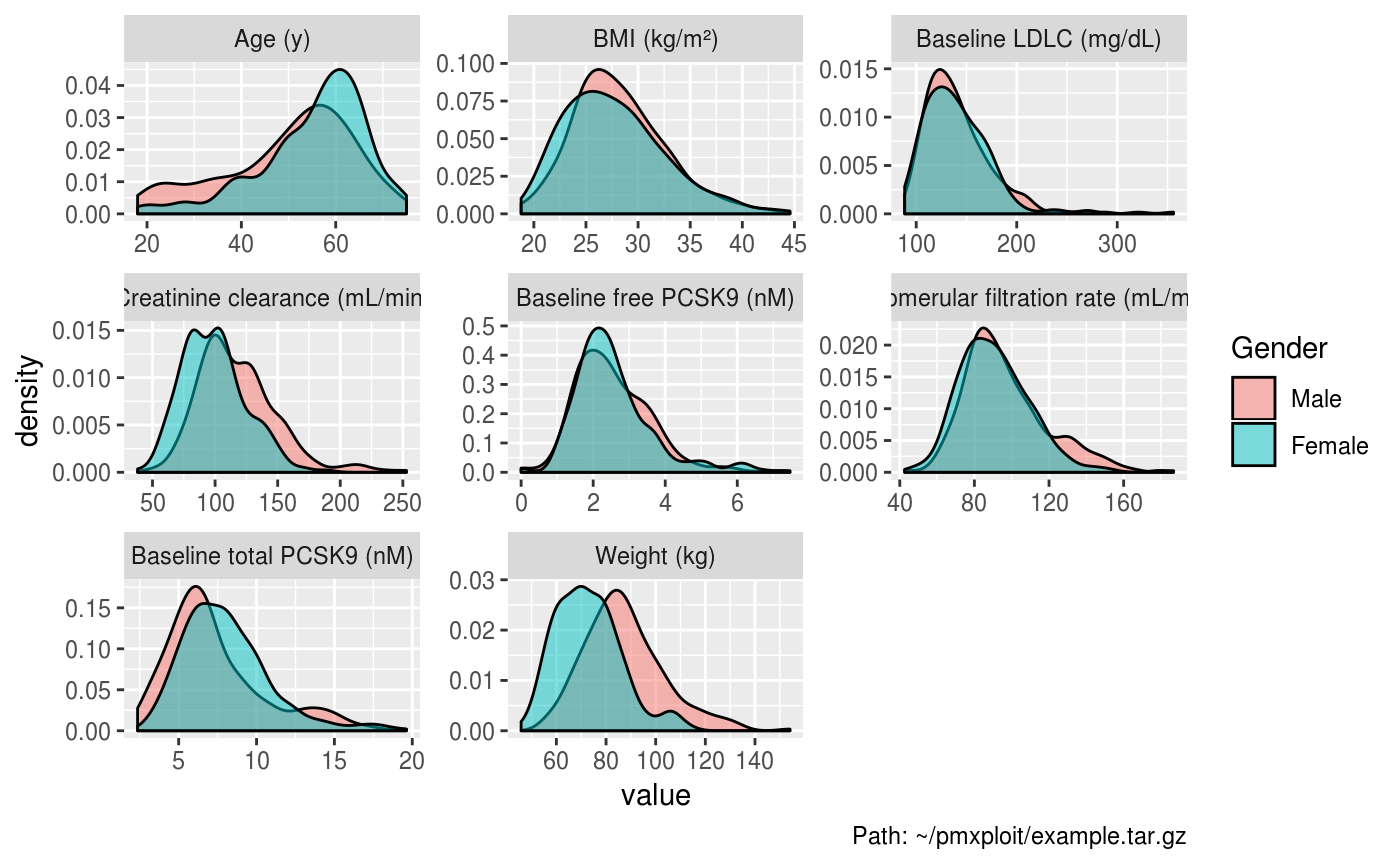
Continuous covariates distributions
plot_continuous_covariates_distributions.RdPlots the distributions of the selected continuous covariates.
plot_continuous_covariates_distributions(run, covariates = NULL,
  baseline_only = TRUE, type = "histogram", histogram_bins = 30L,
  boxplot_facets = TRUE, boxplot_drop_unused = FALSE,
  qq_reference_distribution = qnorm, facet_scales = "free",
  overlay_splits = TRUE, auto_legend = TRUE)
Arguments
| run |
|
|---|---|
| covariates | character vector of continous covariates names. Default is
|
| baseline_only | logical. Consider only the baseline (= first) values of the subjects. Default is
|
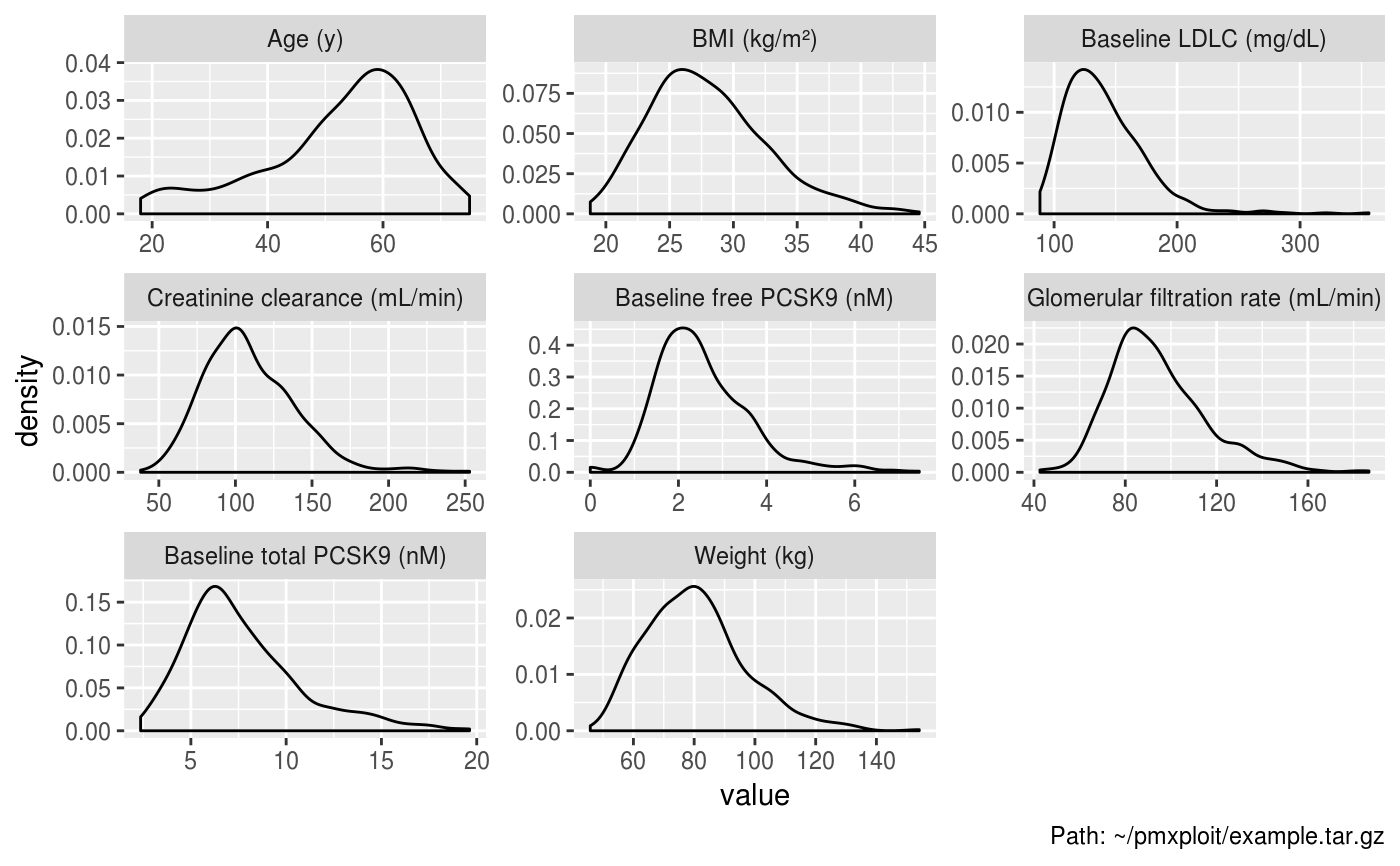
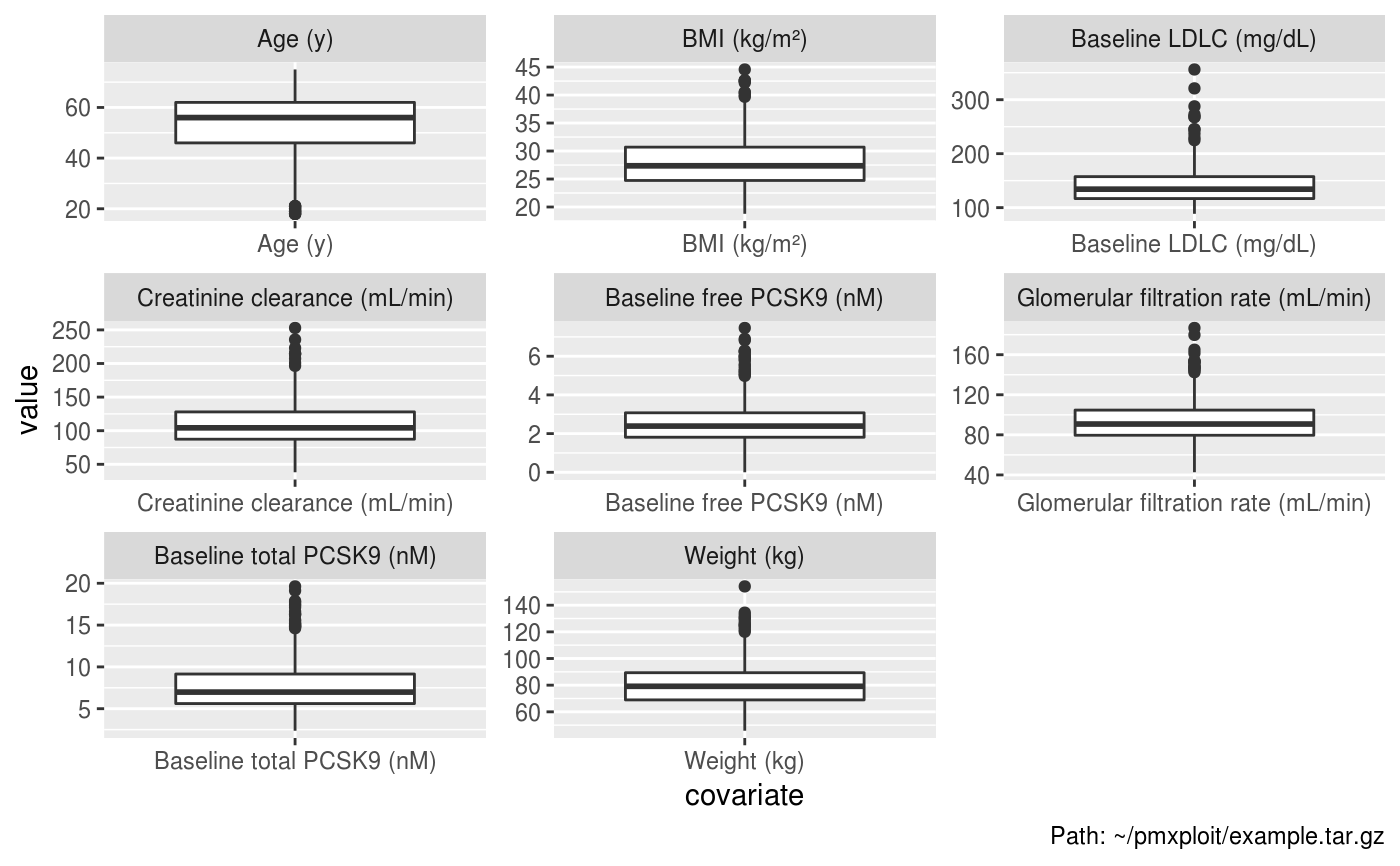
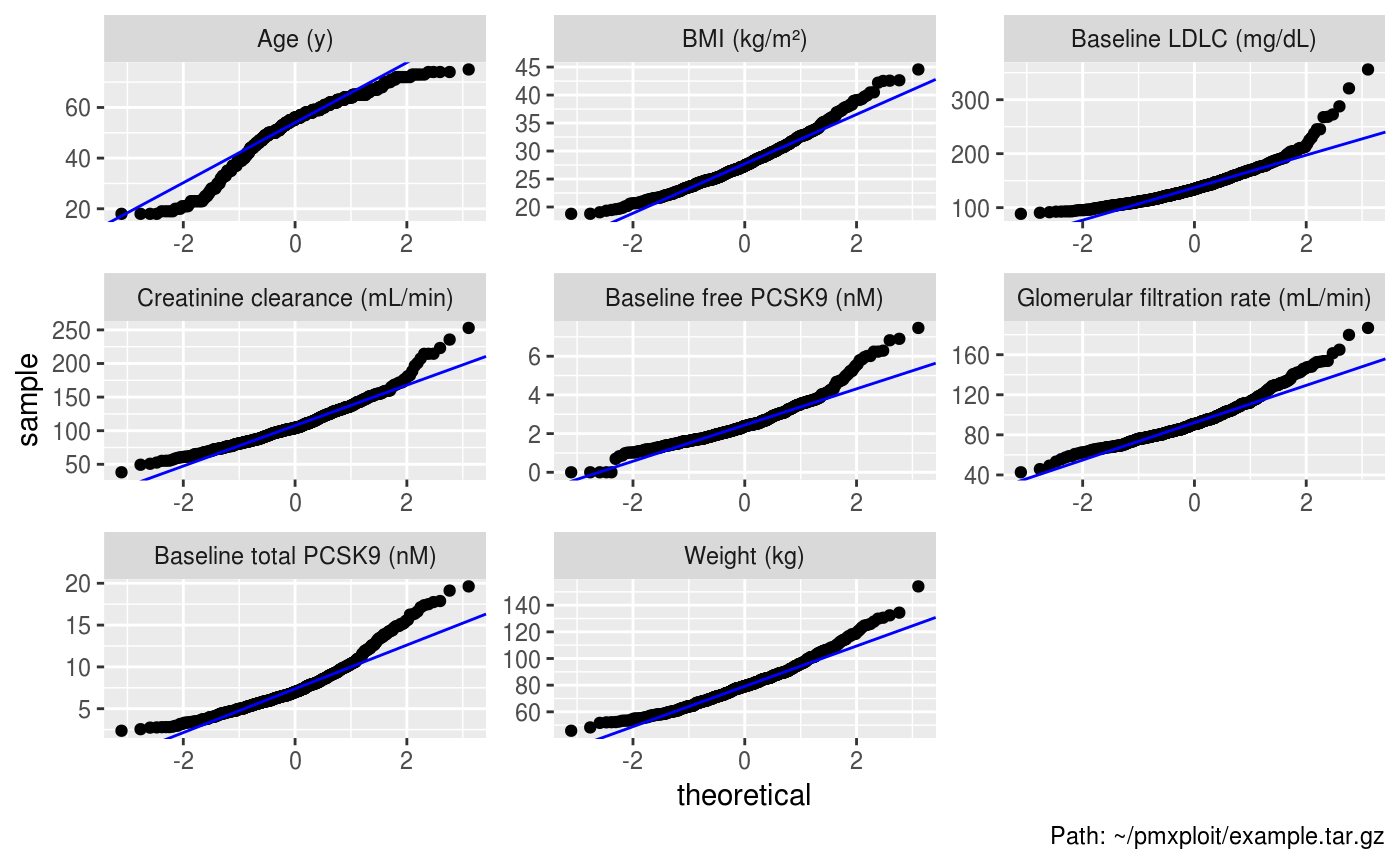
| type | character. Type of distribution representation. One of
|
| histogram_bins | integer. If |
| boxplot_facets | logical. If |
| boxplot_drop_unused | logical. If |
| facet_scales | character. |
| overlay_splits | logical. If splitting is applied, |
| auto_legend | logical. When |
| split_by | character vector. Names of categorical covariates used to split the distributions. |
Value
A ggplot2 object.
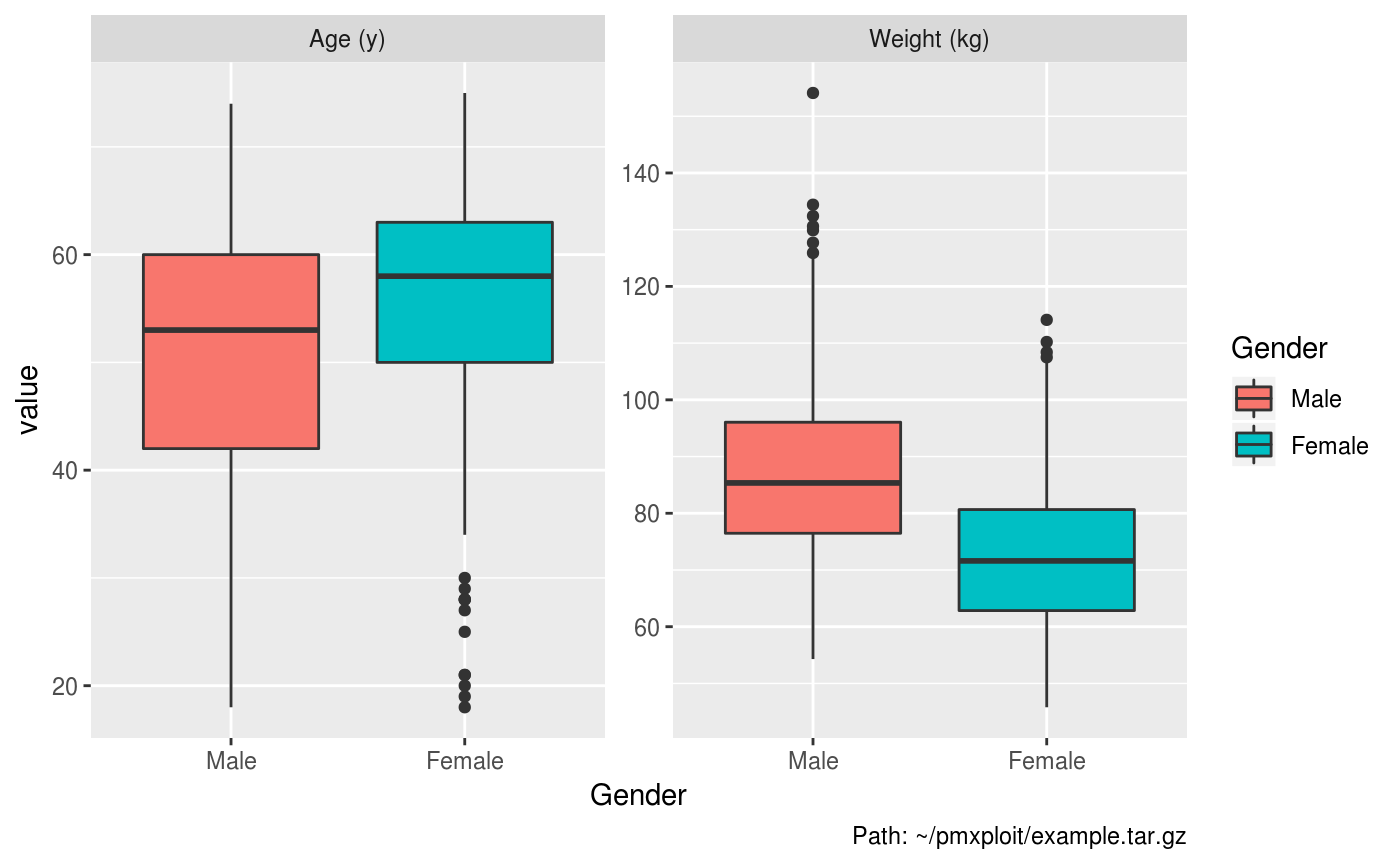
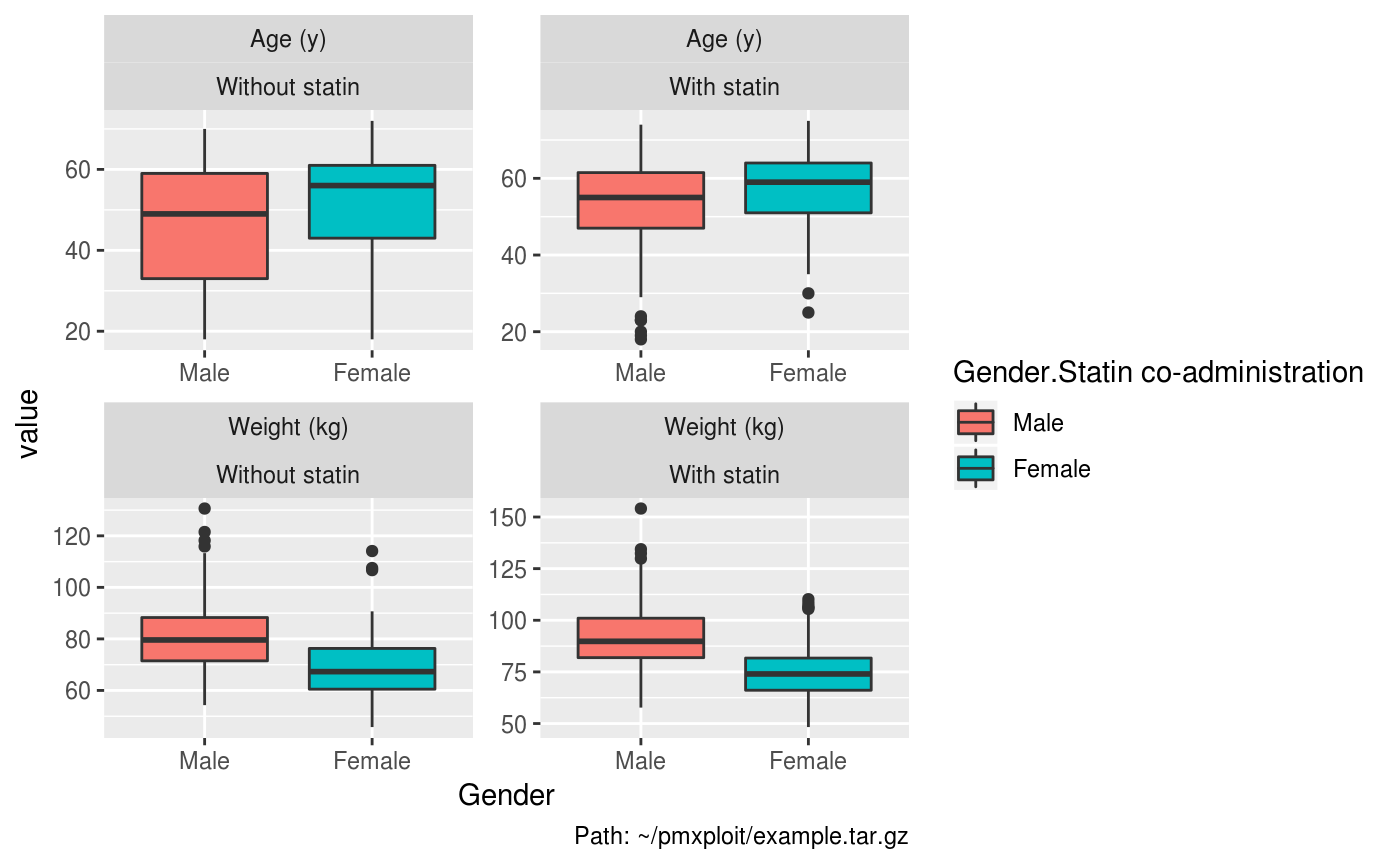
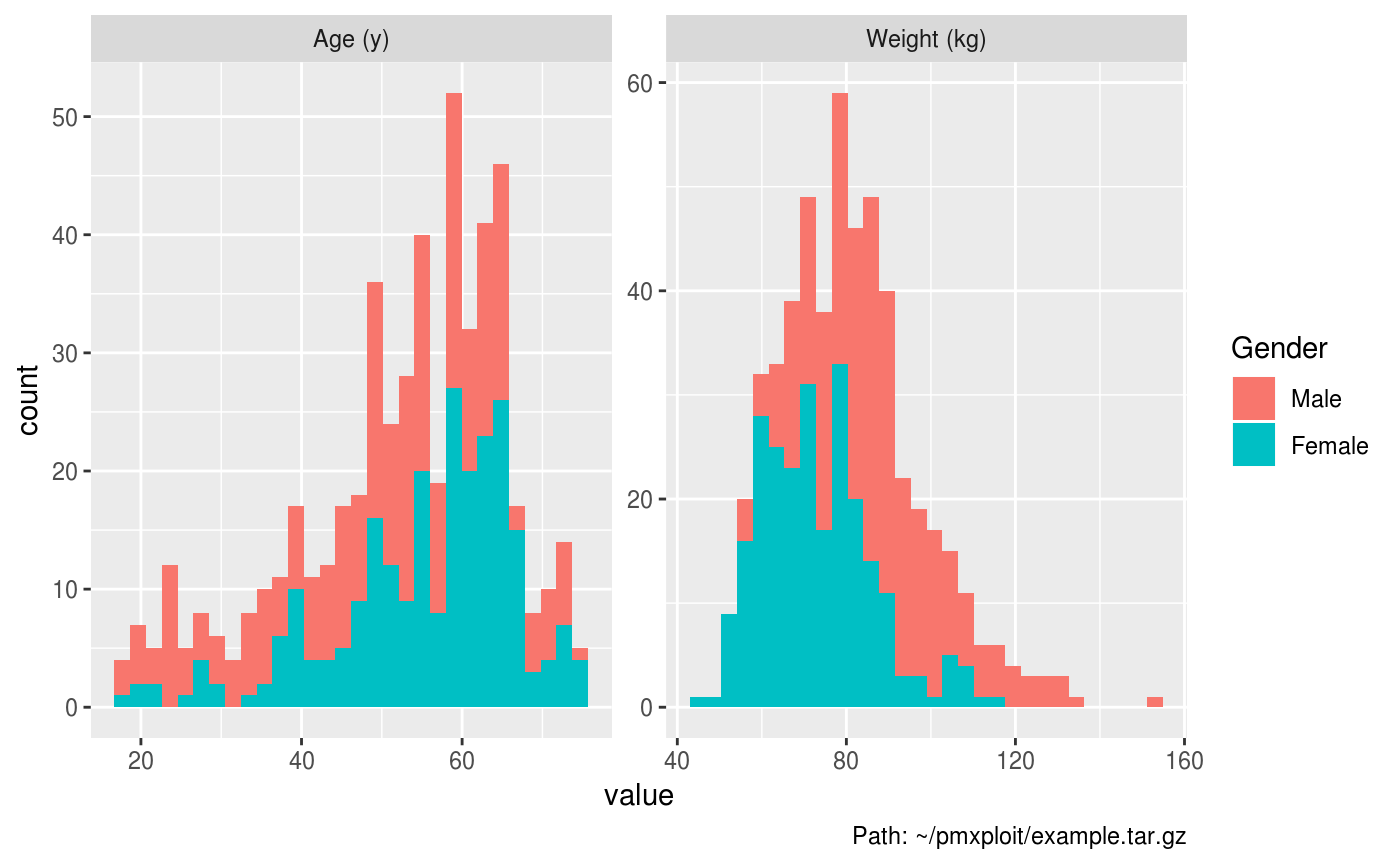
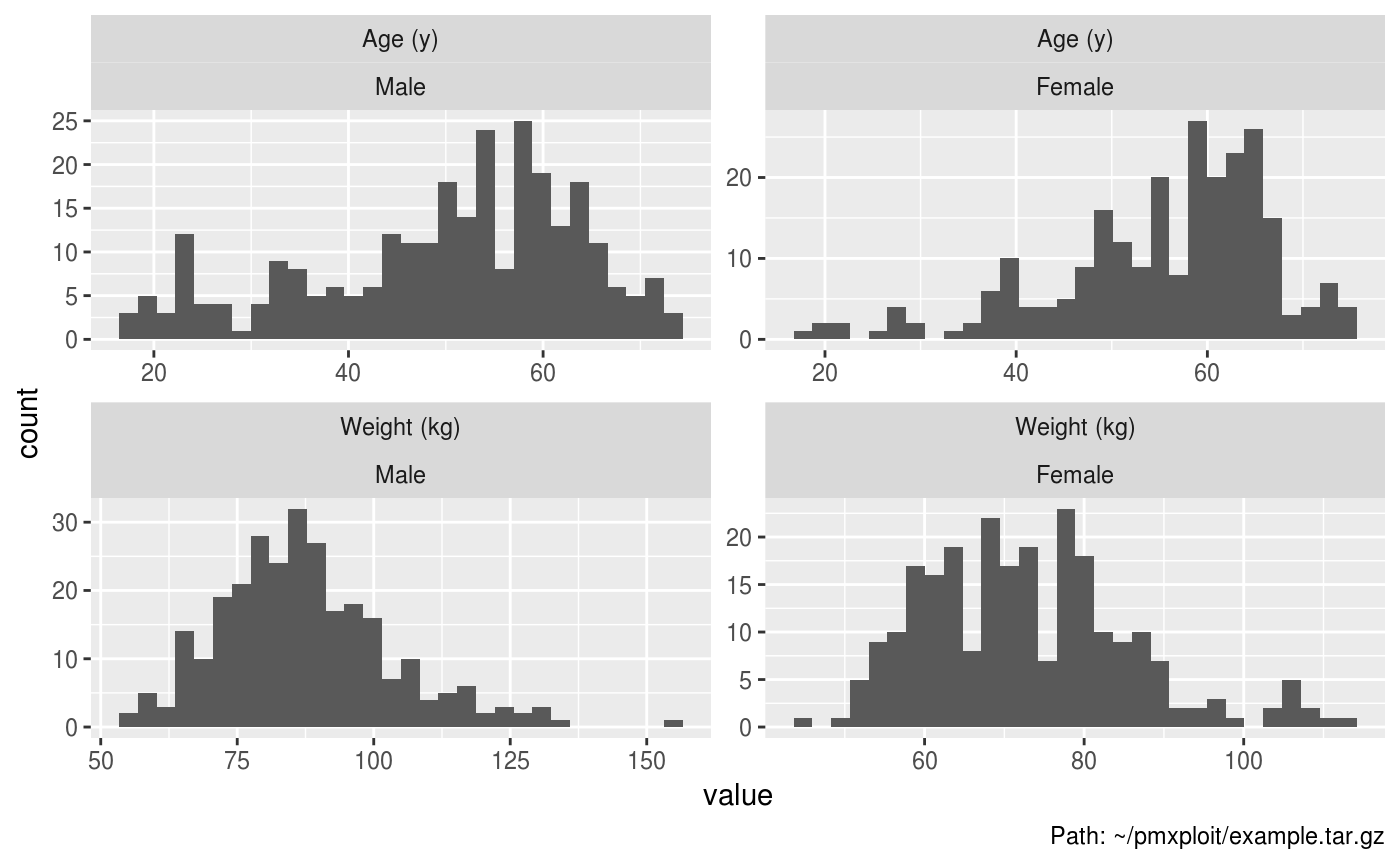
Examples
EXAMPLERUN %>% plot_continuous_covariates_distributions()EXAMPLERUN %>% plot_continuous_covariates_distributions(type = "density")EXAMPLERUN %>% plot_continuous_covariates_distributions(type = "boxplot")EXAMPLERUN %>% plot_continuous_covariates_distributions(type = "qq")EXAMPLERUN %>% group_by(SEX) %>% plot_continuous_covariates_distributions(type = "boxplot", covariates = c("AGE", "WT"))EXAMPLERUN %>% group_by(SEX, STATIN) %>% plot_continuous_covariates_distributions(type = "boxplot", covariates = c("AGE", "WT"))EXAMPLERUN %>% group_by(SEX) %>% plot_continuous_covariates_distributions(type = "histogram", covariates = c("AGE", "WT"))EXAMPLERUN %>% group_by(SEX) %>% plot_continuous_covariates_distributions(type = "histogram", covariates = c("AGE", "WT"), overlay_splits = FALSE)